Troquei o Cooler do Mini-PC M600! Não esperava esse RESULTADO! ID-Cooling IS-30i. UNBOX e BENCHMARKS
O conjunto dissipador, cooler/watercooler e fans nos gabinetes de compuadores são peças fundamentais à manutenção de vida do equipamento.
Como máquinas que dissipam muito calor, os computadores através de suas unidades principais de processamento precisam muito de render bem na medida em que conseguem transferir calor para outras partes e se manterem em operação de forma adequada.
E sobre isso que vamos entender melhor nesse através de teste prático com acertos e dificuldades, contudo reico em informações para proprietários de mini-pcs que estão bastante em alta nas vendas devido as suas diversas vantagens.
E isso que vamos conferir aqui utilizando como cobais um Morefine M600 se a troca de dissipador e cooler é alguma vantagem real ou apenas suposição… Será?
Depois de utilizar por vários meses e fazer diversos testes de desempenho em benchmarks e uso diário sobre pressão em diversas ocasiões acredito que posso mostrar um resposta plausível e valiosa para sua tomada de decisão. Vamos nessa?
FATO RELEVANTE!
O modelo do dissipador e cooler escolhido foi devido a compatibilidade com o formato comercial de furação da placa mãe do mini-pc que atende ao padrão LGA115X/1200/1700 Intel (apesar de ser um produto AMD). Existe uma versão do cooler ID-Cooling IS-30a que é o mesmo mas a “sapata” de encaixe é para AMD AM4/AM5 que não confirmei se também funciona aqui no caso.
PORTANTO! CONFIRME AS ESPECIFICAÇÕES DO SEU MINI-PC ANTES DE COMPRAR!
OBSERVAÇÃO COMPLEMENTAR AO VÍDEO:
⇒ Há algum ponto negativo sobre o conjunto Id-Cooling IS-30i?
Não consegui apurar um ponto negativo diretamente ao conjunto dissipador e cooler. Ele realizou tudo o que propôs sem problema.
Porém…
O que posso chamar de negativo é o efeito colateral. O conjunto não é específico para o mini-pc (o projeto foi para desktop padrão), mas funciona perfeitamente devido a grande potencialidade de atuar com padrões comerciais que esse M600 tem. E dito isto, vamos aos efeitos colaterais.
⇒ A tampa fecha?
Olha, vou dizer que não fecha… fica tão justo a ponto dele conseguir rodar, mas você escuta a ventoinha raspando! Ou seja, não dá certo. Agora, se colocar pequenas aruelas de 1 a 2mm na base de cada parafuso da tampa o cooler vai ficar livre de contato perante a tampa. Isso é tranquilo e fácil. Observe que uma pressão sobre a tampa que a apertar fizer flambar vai encostar no cooler. Sendo assim, melhor é fazer uma tampa custom ou imprimir 3D.
⇒ A tampa superior, no lado das memórias fecha?
Sim e não!
Sim, fecha normalmente e sem qualquer contato caso você não utilize disco HDD/SSD tipo notebook nessa parte.
E não fechará, caso você utilize discos tradicionais. Neste caso, diferentemente ao outro lado, nesta tampa a fixação de parafusos não é vertical ou de topo. Não dá para fechá-la com ligeiro espaçamento e acaba sendo necessário um novo sistema de tampa ou engenhoca para poder adapatar a tampa de fábrica.
E aqui é que você entra para ajudar a ampliarmos nossa rede de contatos ao mesmo tempo que também fica por dentro de dicas e know-how sobre equipamentos iguais ou similares.
Para dar spoiler do que você verá no conteúdo do vídeo os capítulos são:
. É tudo sobre Ar fresco e Performance
. Etapas do Lab troca do cooler e testes
. Unboxing ID-Cooling IS-30i
. Método pra testar e organizar
. Do Script ao Data-Vis
. Fique Ligado! Sobre a Análise
. Teste 01 CPU – SilverBench
. Teste 02 CPU – Cpu Expert
. Teste 03 CPU – CineBench R23 Linux
. Teste 04 CPU – Rendering H.265 Kdenlive Linux
. Teste 05 GPU – GLMark2 Wayland
. Teste 06 GPU – OverWatch 2 Linux
. Teste 07 GPU – Xonotic Timedemo
. Teste 08 GPU – BaseMark 3.0
. Teste 09 GPU – Motion Mark v.1.2
. Vale o Investimento? Quais são?
. Segredos Revelados! Troca difícil?
. Afinal é barulhento ou não?
. Contra fatos não há…
—
É inscrito no canal?
Considere fazer parte e inscreva! Também ative o sino de alerta para estar por dentro assim que chegar um conteúdo novo e muito bom para você.
Clique aqui e pronto:
INSCREVER-ME
// TRANSCRIÇÃO ORIGINAL COMPLETA DA LEGENDA EM PORTUGUÊS BRASIL
Eai, tudo beleza?
Pessoal, o sistema de resfriamento em máquinas que sofrem com efeito Joule é peça fundamental para a consistência em performance. O rendimento do equipamento está atrelado ao quanto ele consegue utilizar sua capacidade máxima teórica sem perder para o aquecimento que prejudica tudo!
Pensando nisto que resolvi avançar na substituição do sistema de ventilação do meu mini pc, o Morefine M600, a qual tenho feito diversos vídeos importantes para quem tem um similar ou mesmo para tomada de decisão de quem deseja comprar um mini desktop tendo uma referência de uso explícita.
Sem delongas, vou apresentar os bastidores da troca que busquei executar de forma laboratorial, uso de inferências estatísticas, bem como, explanar sobre a modelagem de dados para entender os resultados. E confesso que foi um processo bem trabalhoso, mas bastante satisfatório na entrega de dados confiáveis para sua tomada de decisão.
Agora!!! Sabe o que é muito, muito mais fácil? O seu LIKE! Esmaga o dedo ai no Like, é fácil e satisfatório para todos nós! De quebra, já se inscreva no canal e ativa o sino para receber TODAS notificações. Conto com vocês, sério!
Ahhh, preciso ressaltar e agradecer aos inscritos aqui do canal que me contaram sobre essa possibilidade de cooler e foi o pontapé inicial para eu buscar mais informações e trazer direto para todos vocês. Meu muito obrigado pelas contribuições! Vocês são demais!
Seguindo o barco, as etapas para a troca do conjunto dissipador-cooler foram:
. Criação do plano de ação;
. Pesquisa de um script em que eu pudesse armazenar os dados durante cada teste;
. Modelagem dos dados em formato visual para Antes Vs Depois;
. Gravação de cada teste considerando dois grupos: Foco em CPU e foco em GPU;
. Padronização de configurações e equipamentos a fim de inserir menor variação baixando margem de erro.
Quer saber mais detalhes? Veja o no blog após o vídeo! Link na descrição
Ótimo agora que vimos o cooler escolhido vamos às análises importante sobre o antes versus depois:
as configurações da bios foram idênticas
perfil da curva de velocidade do cooler idêntico
sistema operacional utilizado idêntico
apps versões e configs idênticos
equipamento de gravação e medição idênticos
a única variável maior do sistema todo durante a medição do antes versus depois foi o quê?
O dissipador e o cooler, Beleza?
Bora para os testes! Vamos lá. Será que deu bom?
Do script ao Data-Vis
Olha foi executado via cli durante o teste foi feita uma coleta a cada 5 segundos de amostra de dado daí teve uma saída desse arquivo para do tipo csv onde ele foi importado e foi realizado o processamento em um programa de planilha né processamento de planilha foi feito aí o tratamento dos dados logo depois foi gerado os gráficos de visualização.
Um aviso importante aí sobre a síntese de resultados:
Número de amostras corresponde à quantidade de dados coletados em unidade de tempo buscando simetria dos dados.
A temperatura em graus célsius média da CPU bem como o uso em percentual em média da CPU é considerando aí o pré-teste, o durante e o pós-teste até que ele quase chega num repouso
Graus Célsius temperatura ambiente local em graus, ela foi monitorada utilizando aí um termômetro digital simples. O valor considerado de referência foi aquele em que ele permaneceu mais tempo ao longo do teste.
E a pontuação é o critério explícito e específico de cada um dos testes.
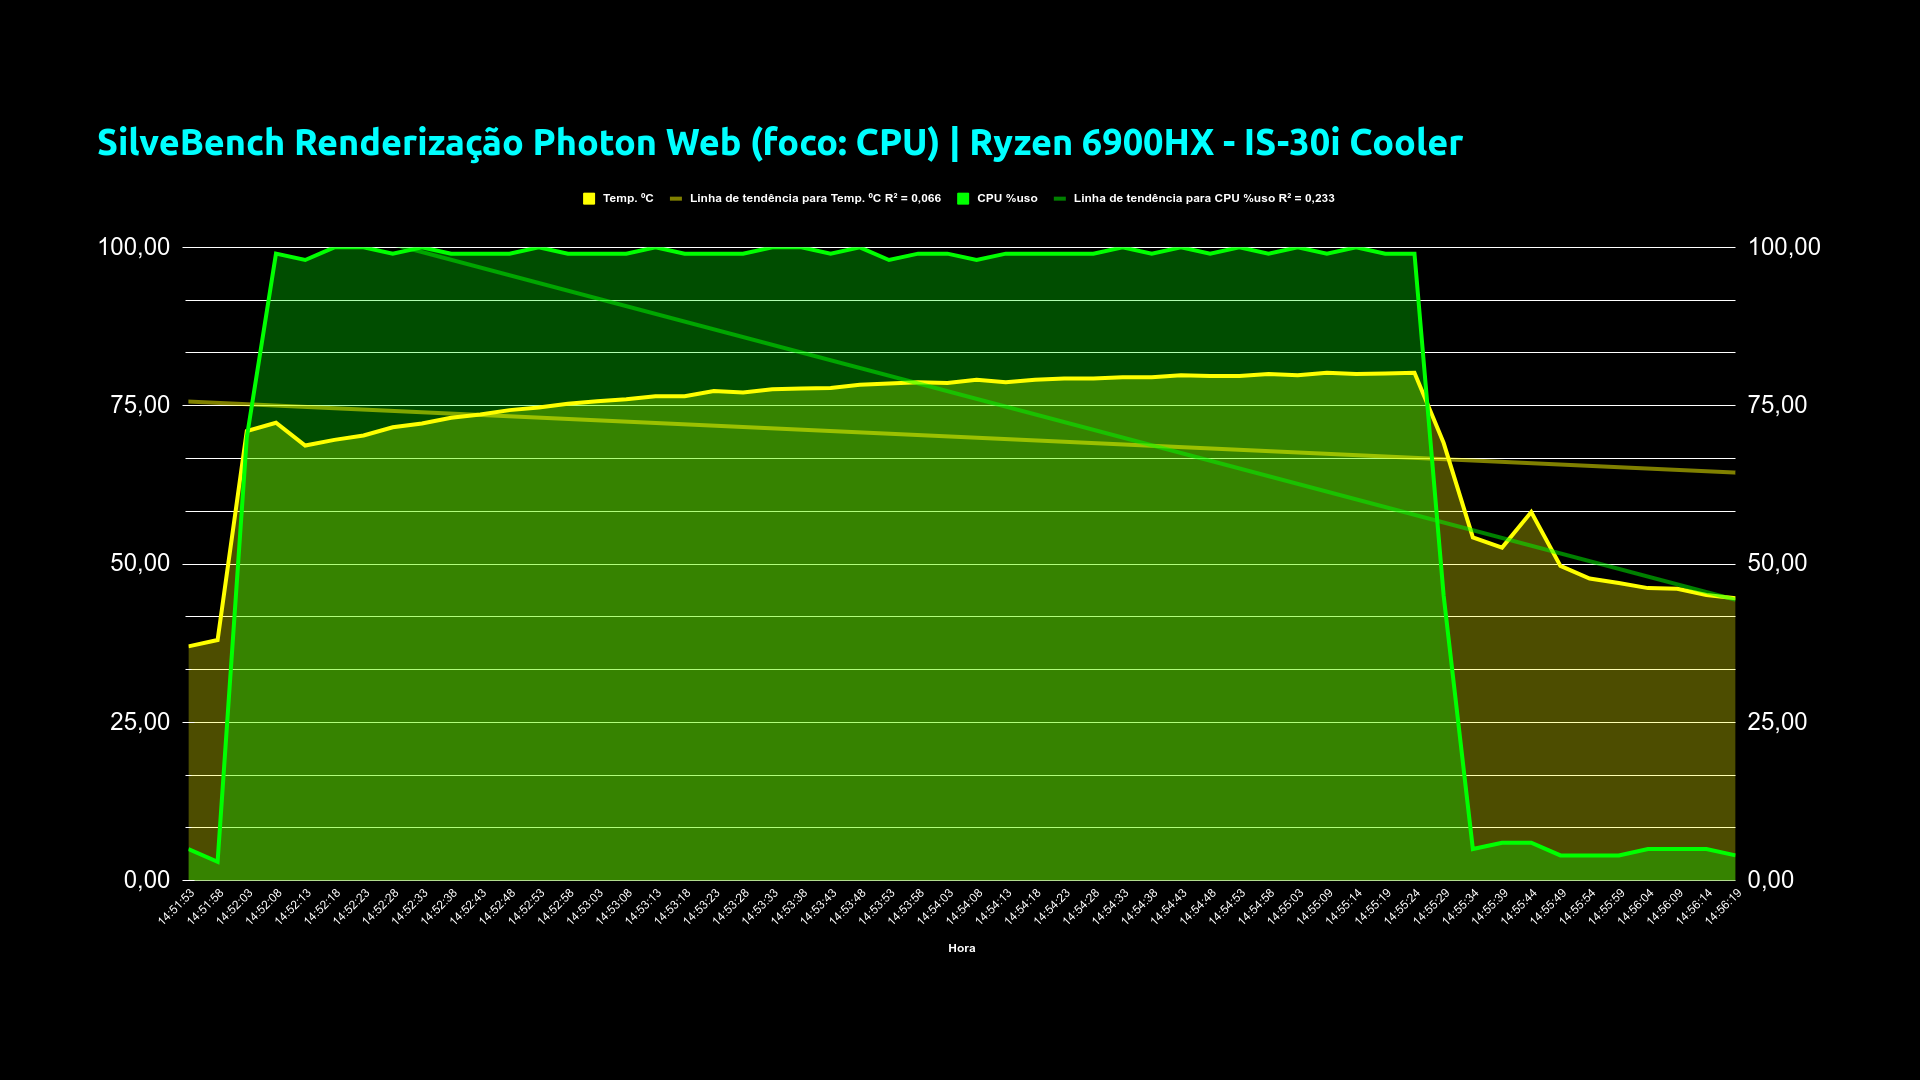
Primeiro teste, o Silver Bench é um teste 100% em CPU usando apenas JavaScript e que através de um motor de renderização de mapeamento de luz verifica a capacidade em tempo de ser realizado o teste.
Olhando aqui o gráfico da renderização nós temos aqui no primeiro momento a plotagem do Stock cooler, ou seja, o cooler padrão original. O quê que a gente já percebe aqui de cara? Vamos dar uma olhada aqui ó em relação à temperatura aqui em amarelo a gente vê que ele logo sobe e ele fica praticamente linear batendo os 90º que é o limitado pelo BIOS lá no TJ Max, ele fica batendo os 90º. Ao mesmo tempo o uso da CPU também fica aqui ó bem cima superior, praticamente no 100%.
E depois quando a gente fez o teste com o novo cooler a gente já percebeu aqui que apesar dele ter mantido basicamente 100% do processo né ali do processador a temperatura já teve uma queda muito boa. Ela saiu do limite lá dos 90 e já deu uma respirada. E a gente até vê que o teste ele finalizou ligeiramente antes do outro.
Vamos ver isso aqui, então na síntese:
Veja bem, nós fizemos aí uma uma coleta das amostras e consideramos aqui a região de 54 amostras em cada um dos testes para ficar igual e vimos aqui que a média de temperatura da CPU houve um queda nela. Nós saímos de um patamar de 82 e poucos para o patamar de 70, ou seja, tivemos uma redução aí de 12 graus efetivamente na média de temperatura. Quanto a média percentual do uso da CPU nós verificamos aqui que houve uma queda também saindo da casa dos 80 para a casa dos 76 uma redução aí no nível percentual de uso da CPU de quatro pontos percentuais aqui.
E vemos o seguinte, que no dia um, que foi feito o teste com cooler padrão a temperatura local temperatura ambiente medido pelo termômetro a qual você pode ver naquele videozinho de resumo que tá super acelerado, estava em 28,70 graus célsius e no dia outro que foi feito a aferição com o novo cooler, o is30, já estava mais quente. Foi um dia mais quente com 29,20 graus célsius naquele momento, ou seja, meio grau aí acima. Apesar de que isso efetivamente não impactou tanto, apesar de uma margem de erro, é claro, mas ainda assim ele conseguiu realizar um bom trabalho.
Aqui o cooler novo de fazer a redução na média da temperatura da CPU e curiosamente também nós vimos aqui que a pontuação aumentou. Como bem foi mostrado a gente lá na percepção do gráfico nós vimos que ele além de ter abaixado a temperatura né média conseguiu efetivar com uma melhor performance um acréscimo de 4,56 por cento na performance! Muito legal né!
Vamos seguindo aqui. Vamos pro próximo teste.
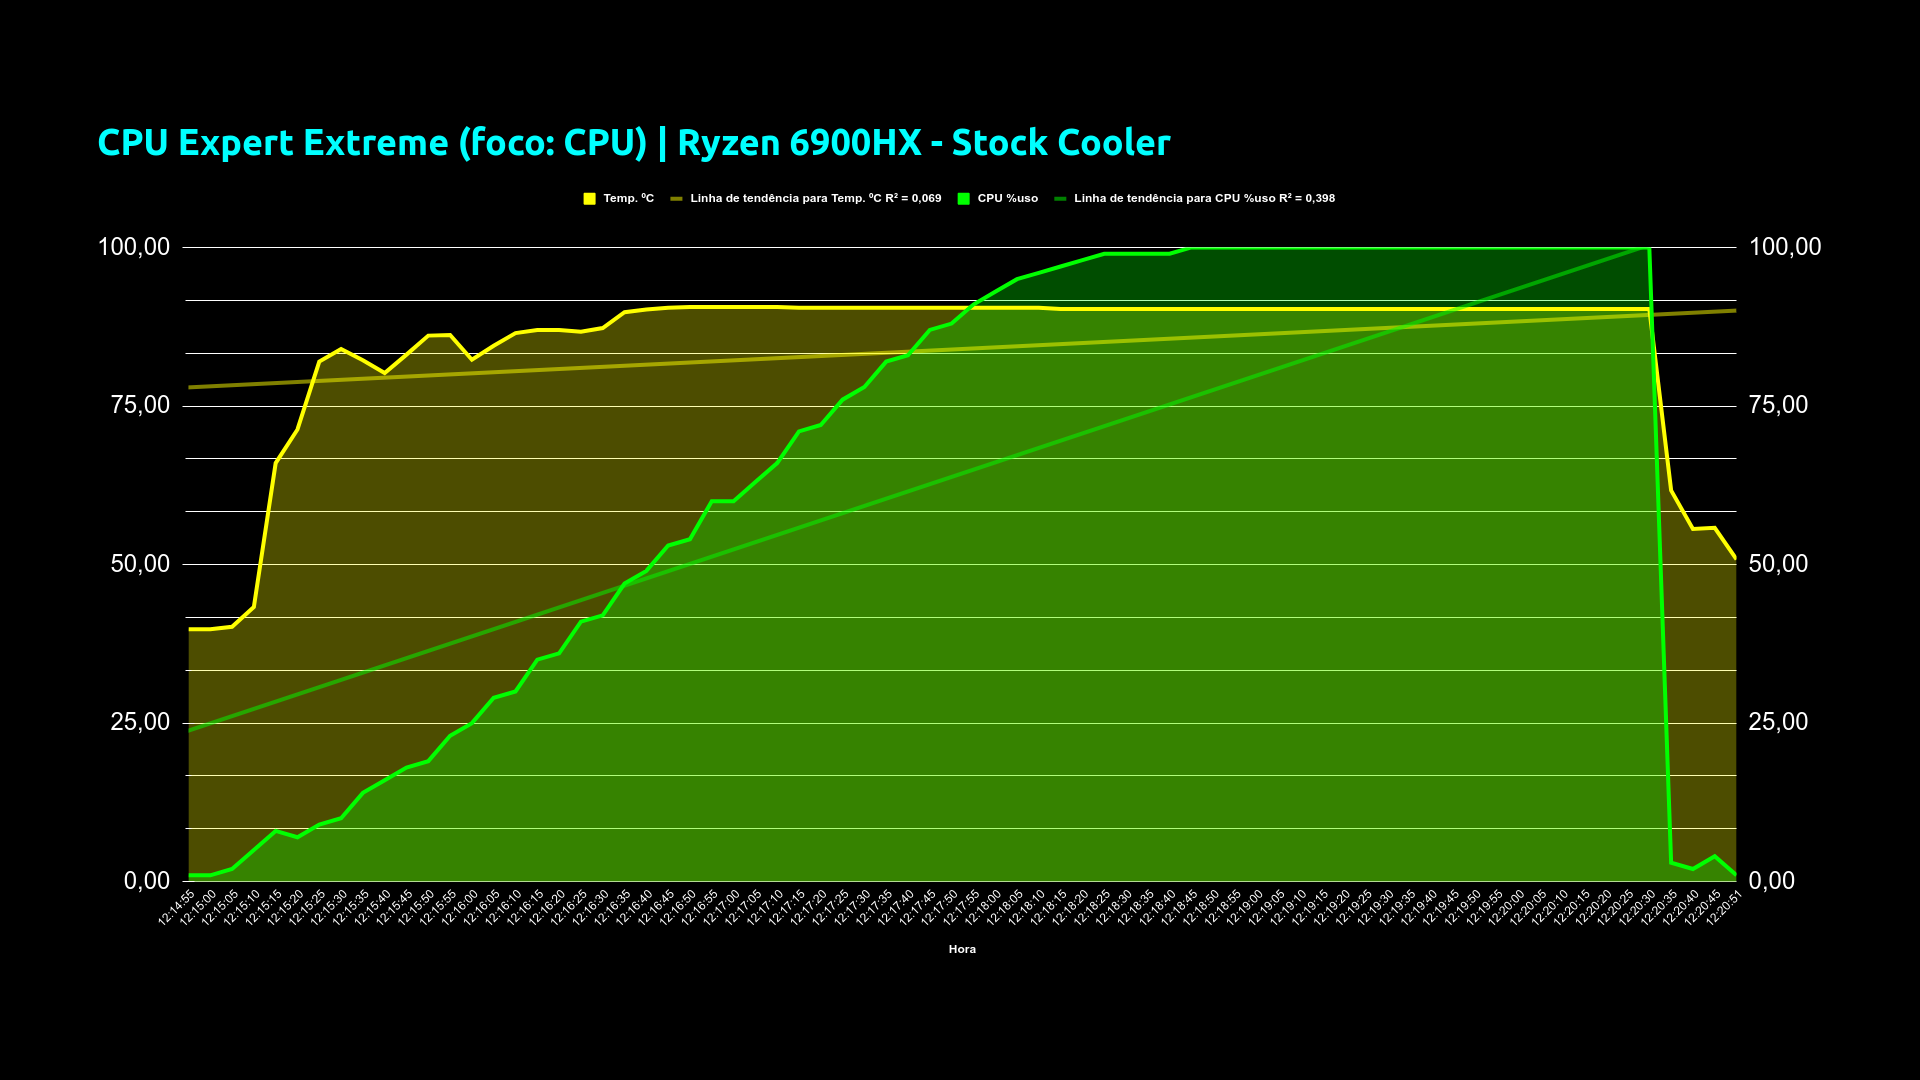
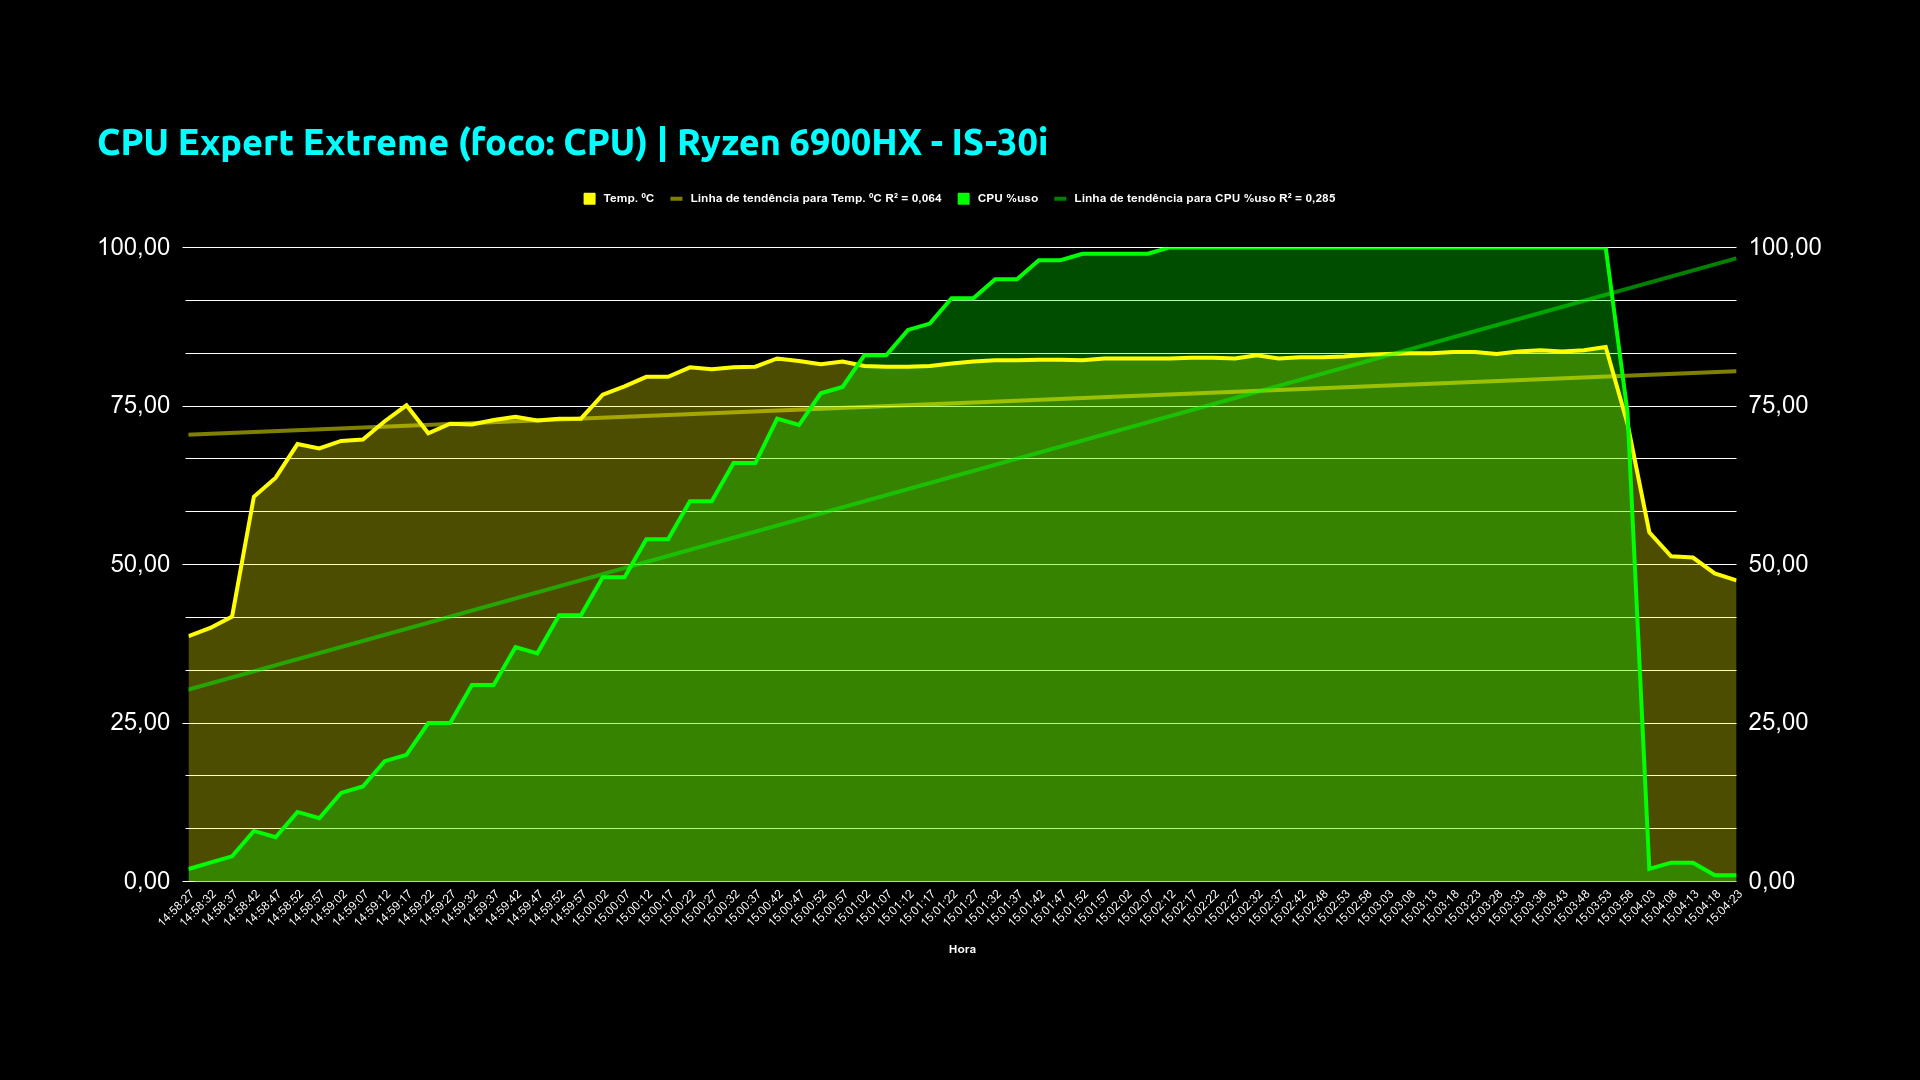
Agora seguindo a gente vai pro CPU Expert. É um teste focado na potência da CPU, ele simula vários cálculos e vai elevando o nível, ao mesmo tempo que sobe a carga de threads, gerando hash, que são algoritmos matemáticos, cada vez maiores.
Pegando aqui o gráfico de referência com o cooler padrão a gente justamente vê a curva de uso da CPU aqui em verde crescendo até atingir o limite quando ele tá com vários threads ali habilitado. E nós vemos também a parte dav temperatura da CPU subindo mais rapidamente e batendo no TJ Max de 90 graus célsius que é o limite lá na Bios de proteção. Quando a gente vai para o cooler novo a gente já vê aqui da mesma forma escada né, a escala de subida aí do uso da CPU também, e a gente já vê também, a escala de subida da temperatura média do processador. Porém mais uma vez ele não tá mais batendo lá em cima no TJ Max. O quê que a gente vê em síntese aqui, nós capturamos aí 72 amostras nos dois testes. Nós tivemos aí mais uma vez uma queda na média de temperatura num total de 8,51 graus célsius em queda de temperatura. Tivemos aí basicamente o mesmo percentual de uso de CPU. Tá lembrando aqui que, esse essa média, ela apesar dele bater lá no 100% né a média ela considera o momento quase que de repouso a o processamento total e um repouso de novo. Por isso que a média é mais baixa do que o máximo que ele atinge. Perfeito! E a temperatura ambiente? Nós tivemos aí um pouquinho superior ou seja o segundo teste com cooler novo o is30 foi realizado com um pouquinho de temperatura a mais ou seja mesmo assim ele ainda conseguiu fazer excelente aí arrefecimento do sistema. E a pontuação, nós saímos de 153 para 151 e poucos, elevando aí em 1.22 por cento. Continuamos ganhando performance.
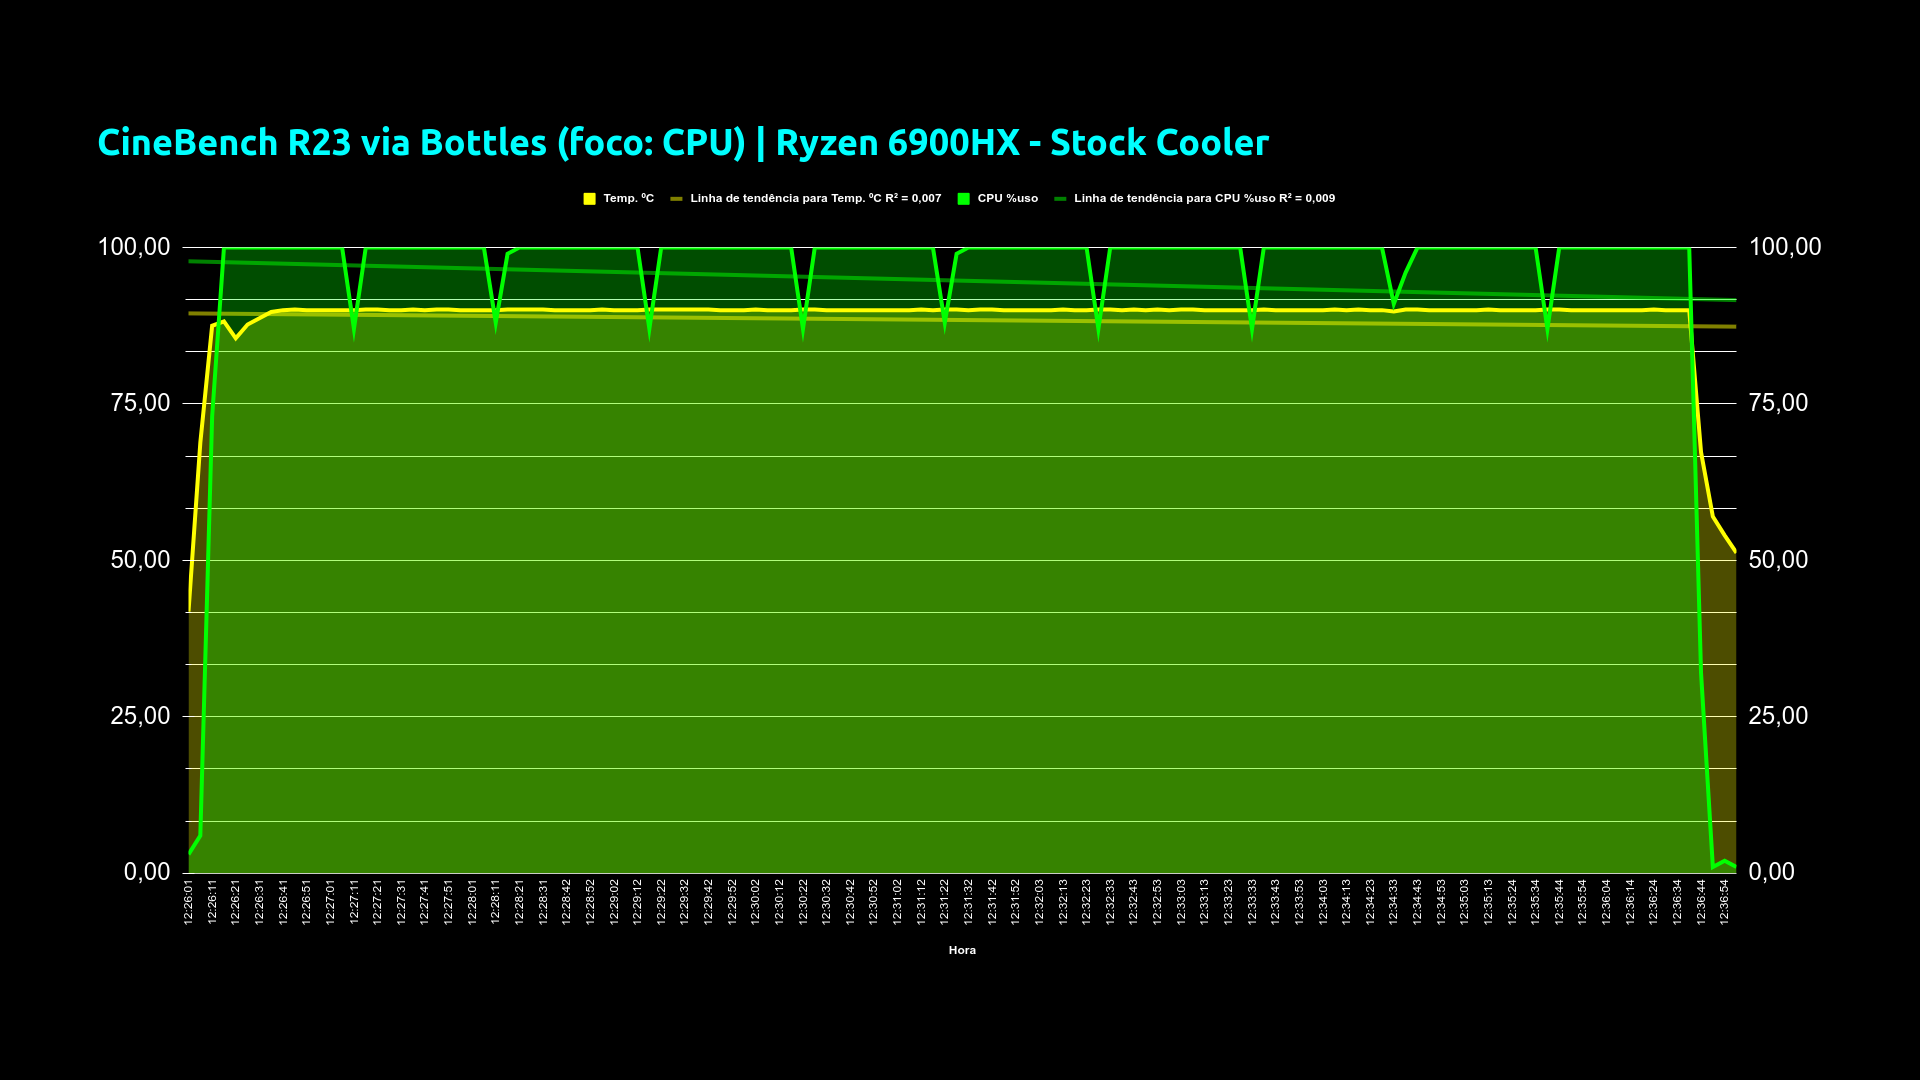
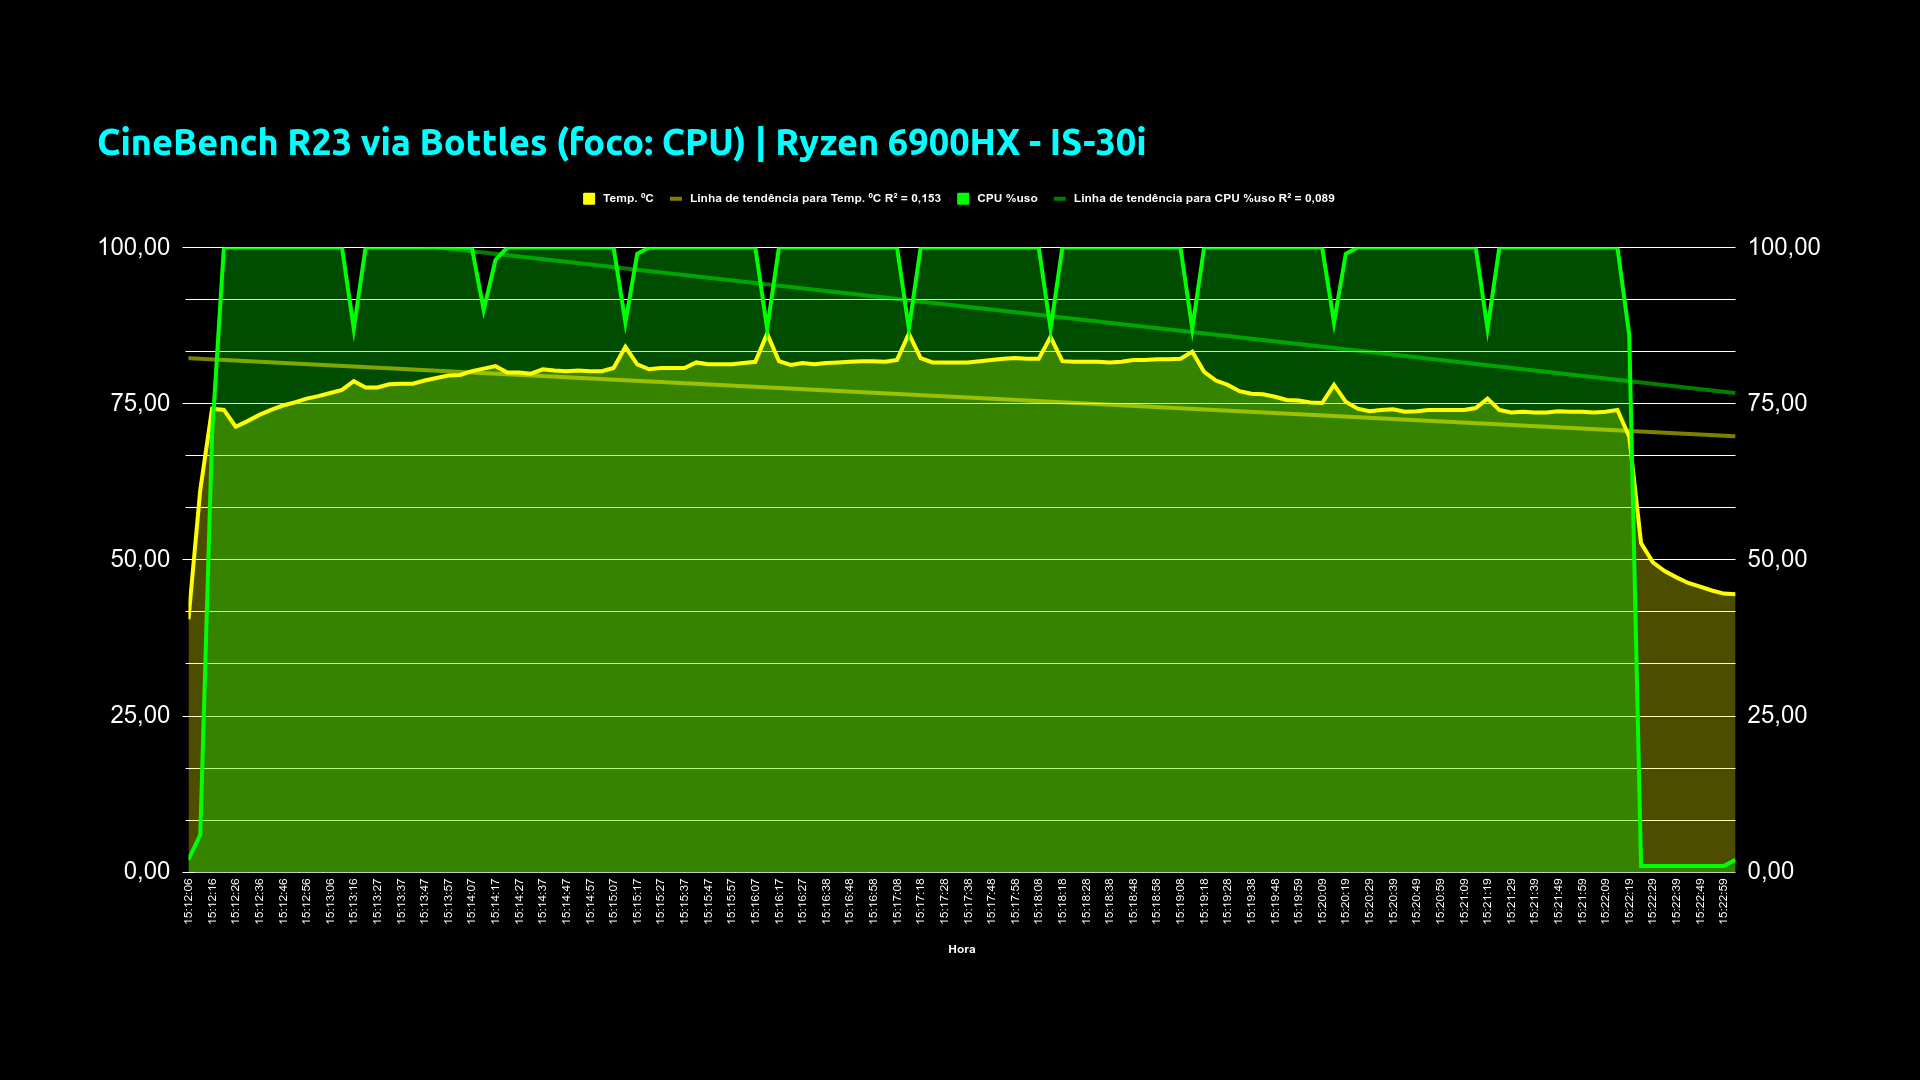
Seguindo o teste, esse é o Cine Bench R23. Já trouxe aqui em outros vídeos, inclusive do mini PC. É um software que tem como objetivo testar o extremo uso da CPU em utilizando tanto um núcleo quanto múltiplos núcleos. No caso desse, foi só no múltiplos núcleos que eu utilizei, tá? Através de cálculos matemáticos avançados que vai renderizar um modelo tridimensional transformando em uma fotografia realística.
No gráfico aqui, como que a gente pode já verificar isso daqui, nós temos que a temperatura em amarelinho né. Pegando aqui a consideração das amostras já subindo e rapidamente ele bate atingindo o TJ Max e ele fica praticamente todo o tempo da da renderização ali travado nos 90 graus célsius e a CPU batendo lá em cima e dando essas quedas bruscas que representam, porque justamente como ele tá batendo lá no limite ele tenta subir dando Boost além do 100% da CPU que ele tem. O Boost né, e volta ele sobe e volta, né dá uma resfriada sobe e e baixa novamente e fica nessa oscilação.
Quando a gente vai para o cooler novo, que que acontece o processo de CPU é exatamente o mesmo. Ele vai no máximo da CPU tem hora que ele dá uma caída e sobe pro máximo de novo, mas a temperatura a gente já consegue ver aqui que ele já deu uma resfriada, ele já deu uma baixada em relação ao anterior. Vamos ver esse número!
Olha só, número de amostras 132. Amostras nos dois testes.
A temperatura média a gente viu que ela saiu do patamar de 88 graus para 76 e poucos, ou seja, baixou 12.39 graus célsius aí na média da temperatura. Ao passo que o percentual médio da CPU, considerando margem de erro e tudo, ele quase que se manteve, mas mesmo assim é uma leve, um leve aumento de 4,11 por cento na média.
Tá, a temperatura ambiente aqui mais uma vez né, o dia foi esquentando mais rápido então no segundo teste com o novo cooler ele já estava um pouquinho mais quente 0,55 graus célsius a mais né, o que dá uma certa desvantagem, mas ainda assim a gente percebe que ele conseguiu fazer uma ótima baixa na média de temperatura e a pontuação melhorou né.
Ele conseguiu aí, sair de 12.580 para 13.155, ou seja, aumentou em 4,37 por cento.
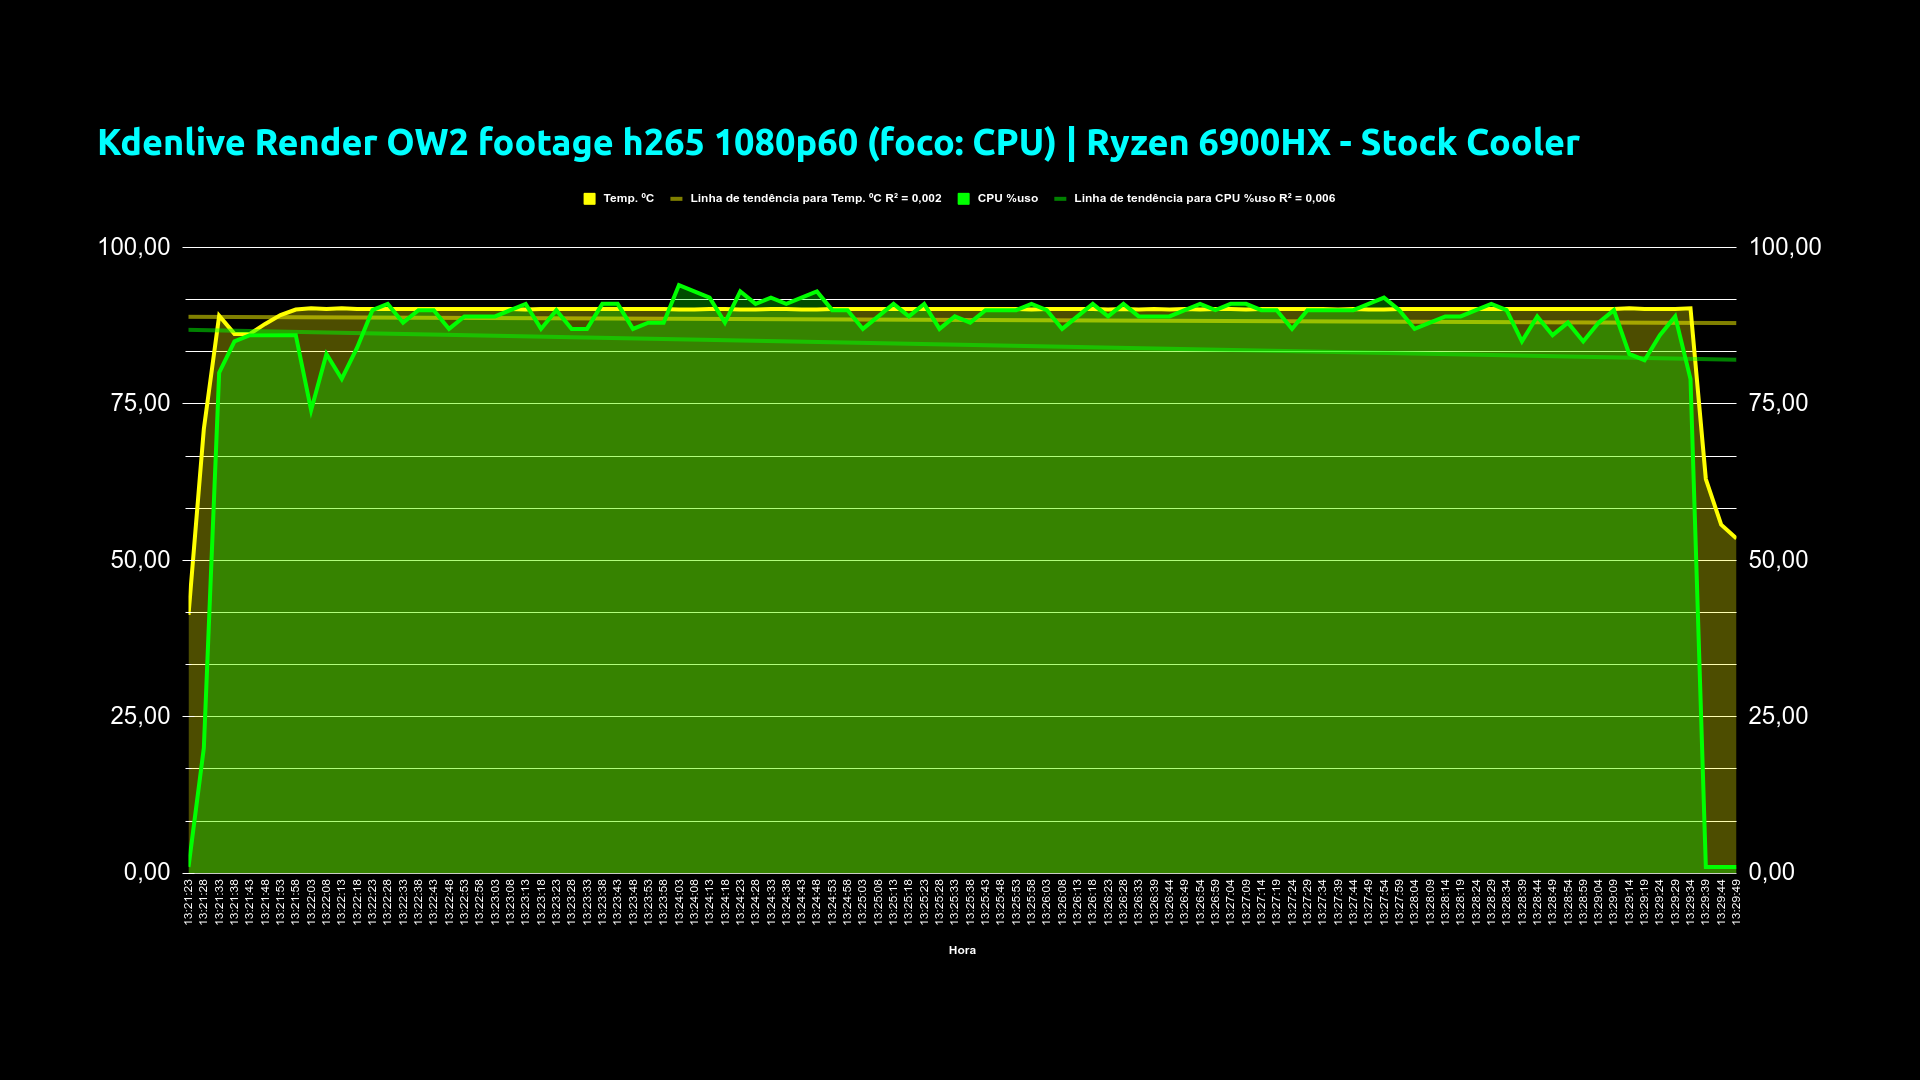
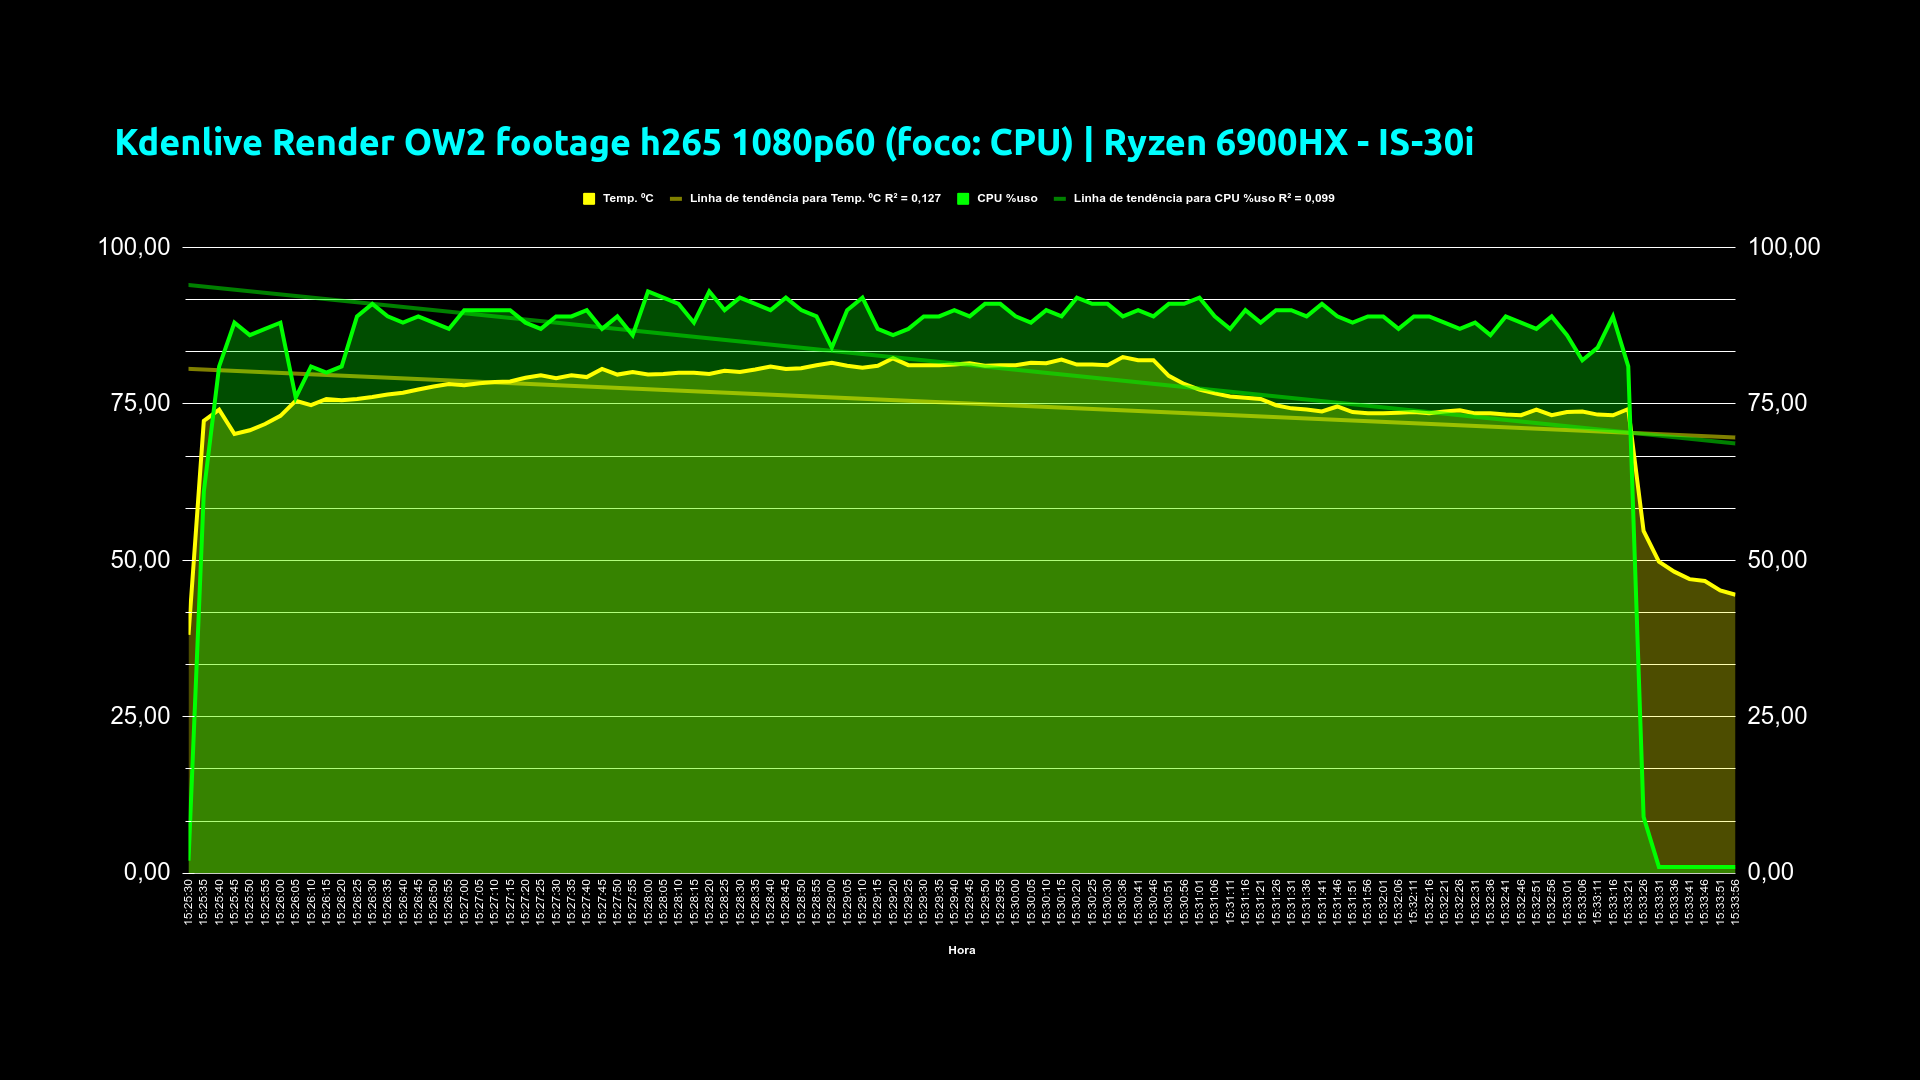
Seguindo agora fazendo uma renderização de vídeo através do kdenlive que é o software de edição de vídeo que eu utilizo basicamente todos os vídeos aqui do canal foi feita uma
exportação de um mesmo vídeo utilizando o perfil de Encoder, o h265, tá, via CPU não foi com auxílio aqui de placa de vídeo nem nada, foi estritamente usando a CPU. Um padrão de vídeo em 1080p 60 quadros por segundo. Na realidade o vídeo é um footage de uma Gameplay do OverWatch 2 que eu tinha gravado. Então, mesmo ajuste fino no Encoder em relação à: qualidade threads, processamento paralelo e velocidade do Encoder. Foi usado Igualmente. E o que que a gente viu aqui na plotagem do gráfico?
A gente sai de um estado aqui mais de início de processamento e a carga vai pro máximo rapidamente, onde a gente tem mais uma vez aqui como o uso excessivo de CPU ele bate no TJ Max de 90º com a CPU padrão né, o cooler padrão e nós temos aqui uma oscilação, aqui sub vindo e descendo.
Aqui em relação ao percentual de uso da CPU ficando aí num numa na média aí de uns 90 ou 80 e tantos por cento. Quando a gente muda, faz o mesmo teste com o is30 que que a gente já pode reparar? Que a CPU teve um gráfico bem similar também batendo alguns momentos. Ela foi até mais e nós vemos aqui a queda da média de temperatura em toda a curva do processo aqui realizado. Vendo isso na síntese, que que a gente tem?
Foram coletadas 122 amostras. Na realidade considerado 112 amostras o tempo de coleta foi maior, mas considerou-se aqui 122 que é pegando justamente o mesmo intervalo tá. Onde a média de temperatura da CPU mais uma vez ela saiu da da casa dos 88 para o 75 diminuindo a média em 13.31! Muito bom, a CPU praticamente inalterada né, aumentando aqui só 3,111, mas gente nem considera muita coisa não.
A temperatura ambiente nessa hora deu certinho no momento que eu tava fazendo os teste estava em 29,50 no maior período considerando o maior período do teste nessa mesma temperatura. E aqui a gente pode ver um ganho de 3,48 por cento de performance. Lembrando que, renderização gasta-se um tempo, e quanto menos tempo você gastar para fazer a renderização do mesmo arquivo, quer dizer que você tá conseguindo uma performance maior que é o que acontece. Ele renderiza em 488 segundos no primeiro momento e depois no mesmo vídeo ele renderiza em 471! Show!
Seguindo, nós vamos aqui pro GLMark 2. Utilizando aí wayland, tá?
O sistema operacional, apesar de não ter comentado antes, que independe aqui porque tudo foi mantido igual, mas eu estava usando aqui um Ubuntu LTS 22.04.
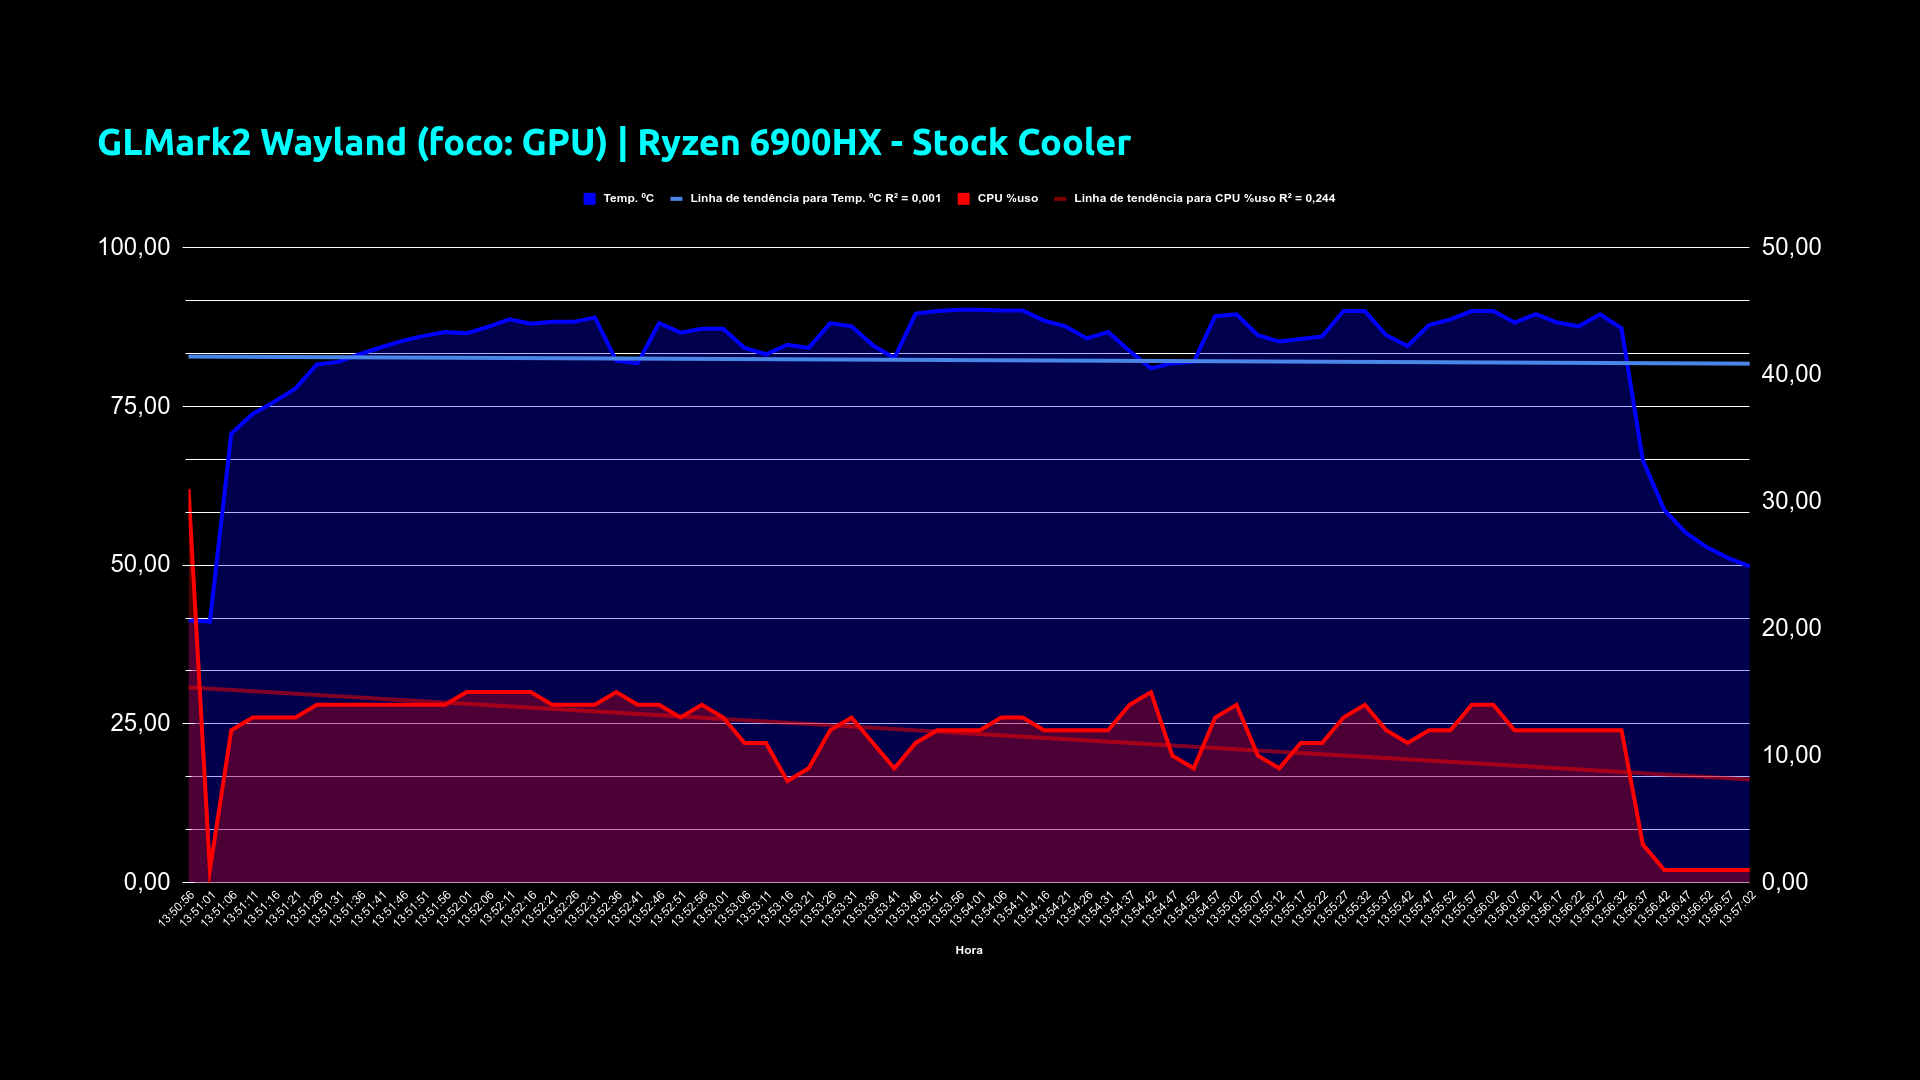
Então o GLMark2, teste que visa medir qual o potencial do conjunto gráfico junto à CPU usando as tecnologias visuais de renderização 3D em tempo real, usando a api do opengl.
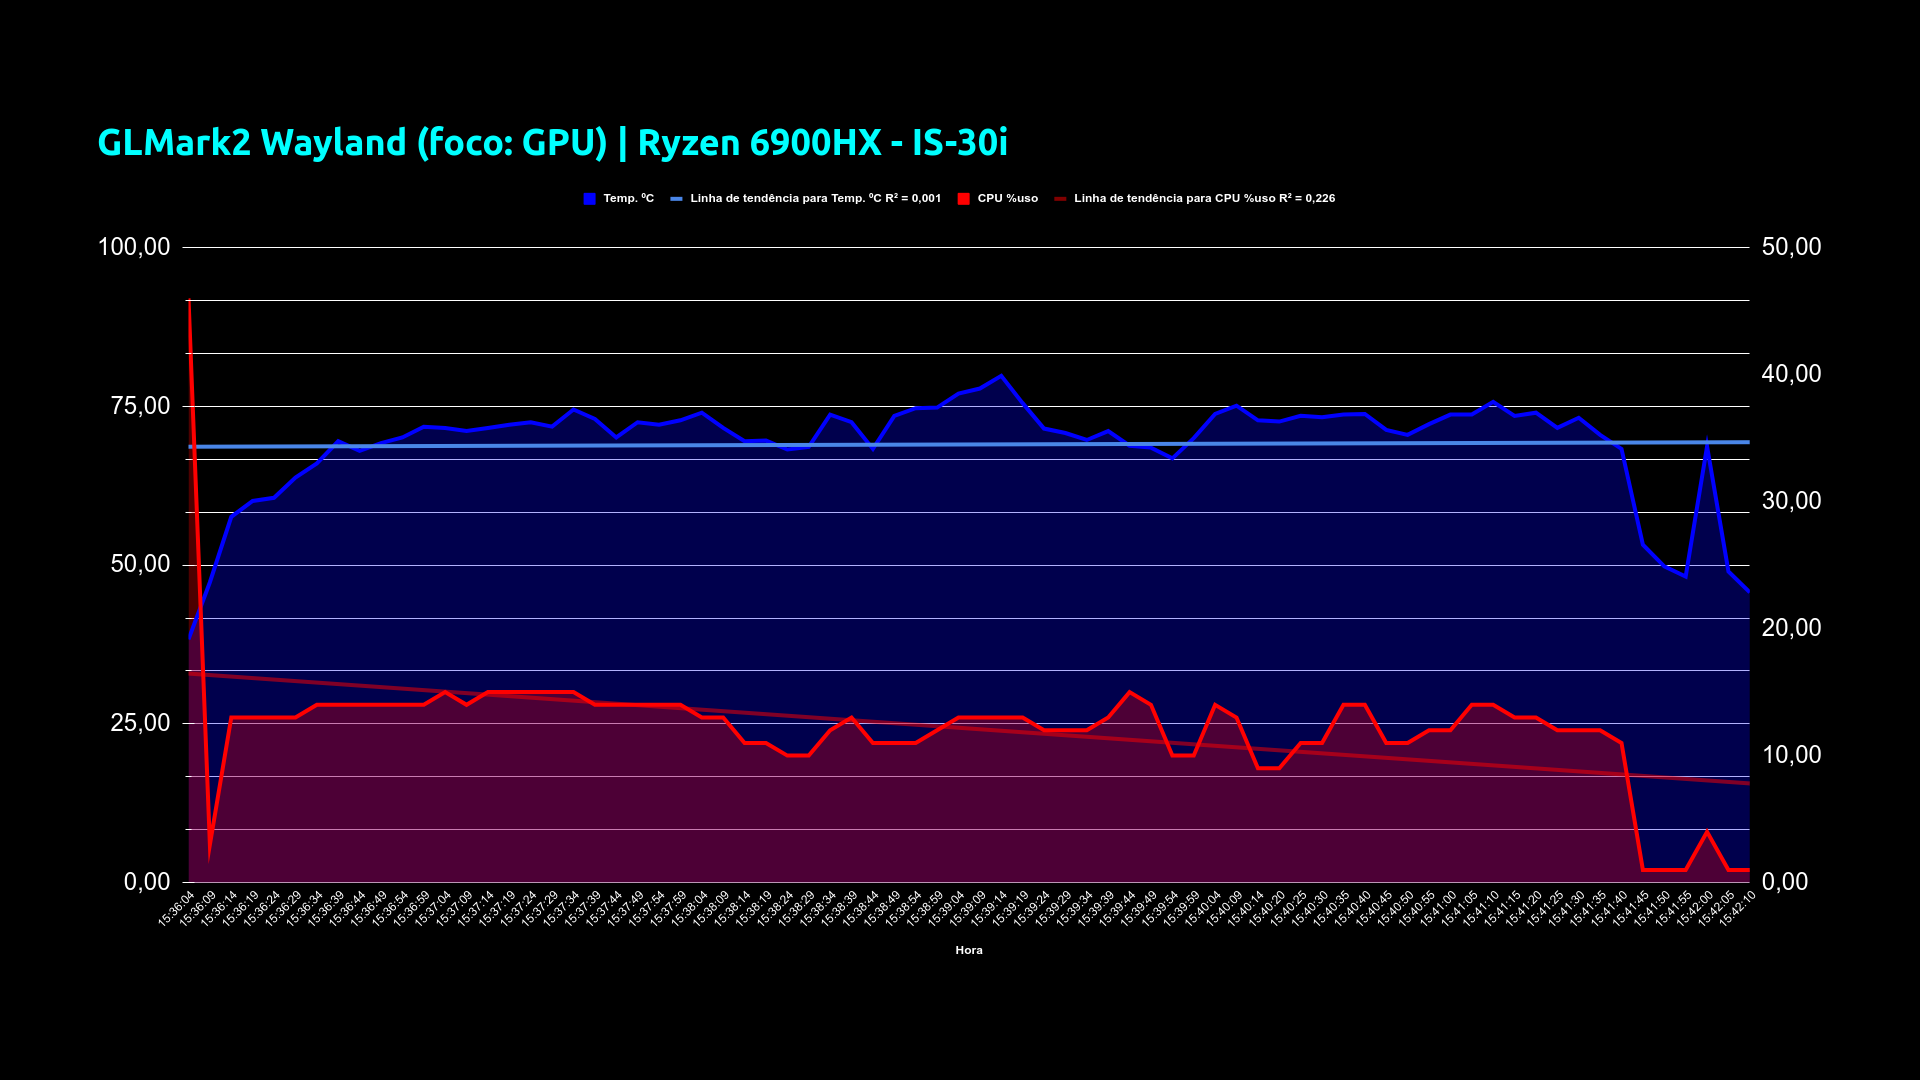
Vendo aqui a plotagem de gráfico já tem uma mudança de comportamento porque os primeiros testes estavam focado naqueles benchmarks que usam excessivamente a CPU. Nesse daqui eles estão focados no que usam excessivamente a GPU. Porém, como esse mini-pc ryzen, ele usa uma APU. O que que é isso? É um processador que tem junto né, trabalha tanto a CPU quanto a GPU ali num soquete. Então você tem essa APU então uma coisa acaba que impacta diretamente na outra tanto em processamento de certa forma quanto na temperatura de distribuição geral. Aí a gente começa a ver aqui que bacana… Utilizando o cooler padrão, o que a gente tem a temperatura aqui ó quase batendo no TJ Max, mas ela bem alta em todo momento aqui da realização do GL Mark 2 não é mesmo. Que o uso da CPU como a gente pode até ver na linha de tendência aqui tá mais baixo, nós estamos aí utilizando a CPU na casa média aí dos 15% vamos dizer assim, certo?
Então vamos ver como que foi a curva. Olha só que legal! Que a gente viu aqui agora quando a gente mudou pro IS-30, a gente manteve praticamente uso percentual de CPU mas nós tivemos aqui uma queda significativa na temperatura da APU como um todo o que é muito legal vendo isso daqui agora na síntese.
Foram 74 amostras avaliadas nas duas onde a gente tinha aí a temperatura média da CPU, e quando é CPU aqui na realidade acaba que como eu bem falei é da APU, né, e engloba um pouco aí as duas coisas. Mas saindo de um cenário de 82 para 69, ou seja, uma queda de 13 pontos na temperatura, certo?
Dentro do do percentual de uso médio da CPU a gente vai começar a ver um fator interessante aqui que, como o sistema fica resfriado, olha só a gente começa a ver a CPU subindo mesmo com a queda de temperatura, mas aqui ainda algo desconsiderável vamos dizer assim, mas ela já tá mudando a tendência dela né.
A temperatura ambiente, apesar de que nesse segundo dia ele estava 0.20 graus célsius mais baixo né. É vamos falar que isso tá dentro da margem de erro não chega a interferir em nada não, é como se fosse aqui em vez de 13.28 fosse aqui 12.50 ou 13 graus né.
Eh enfim, e a pontuação, a gente observa mais uma vez que praticamente manteve uma estabilidade, certo? Mas com um leve crescimento.
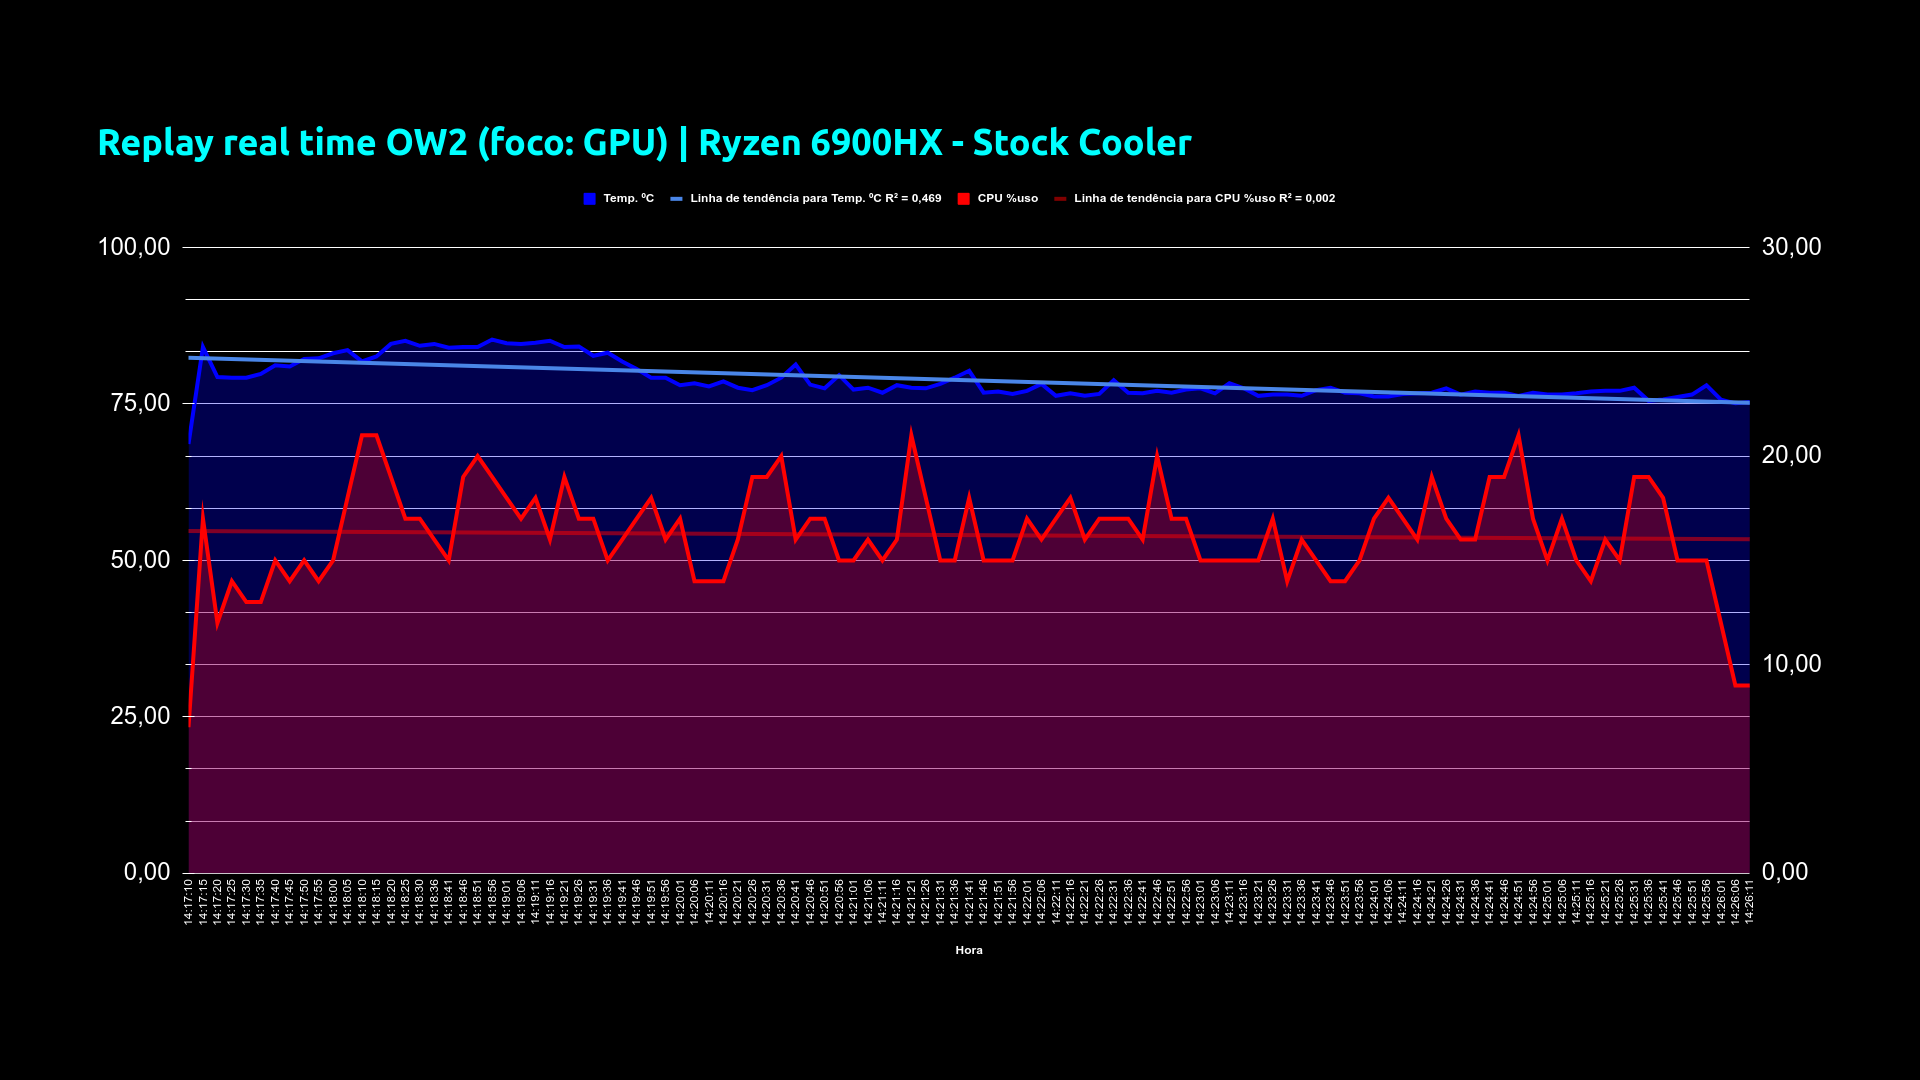
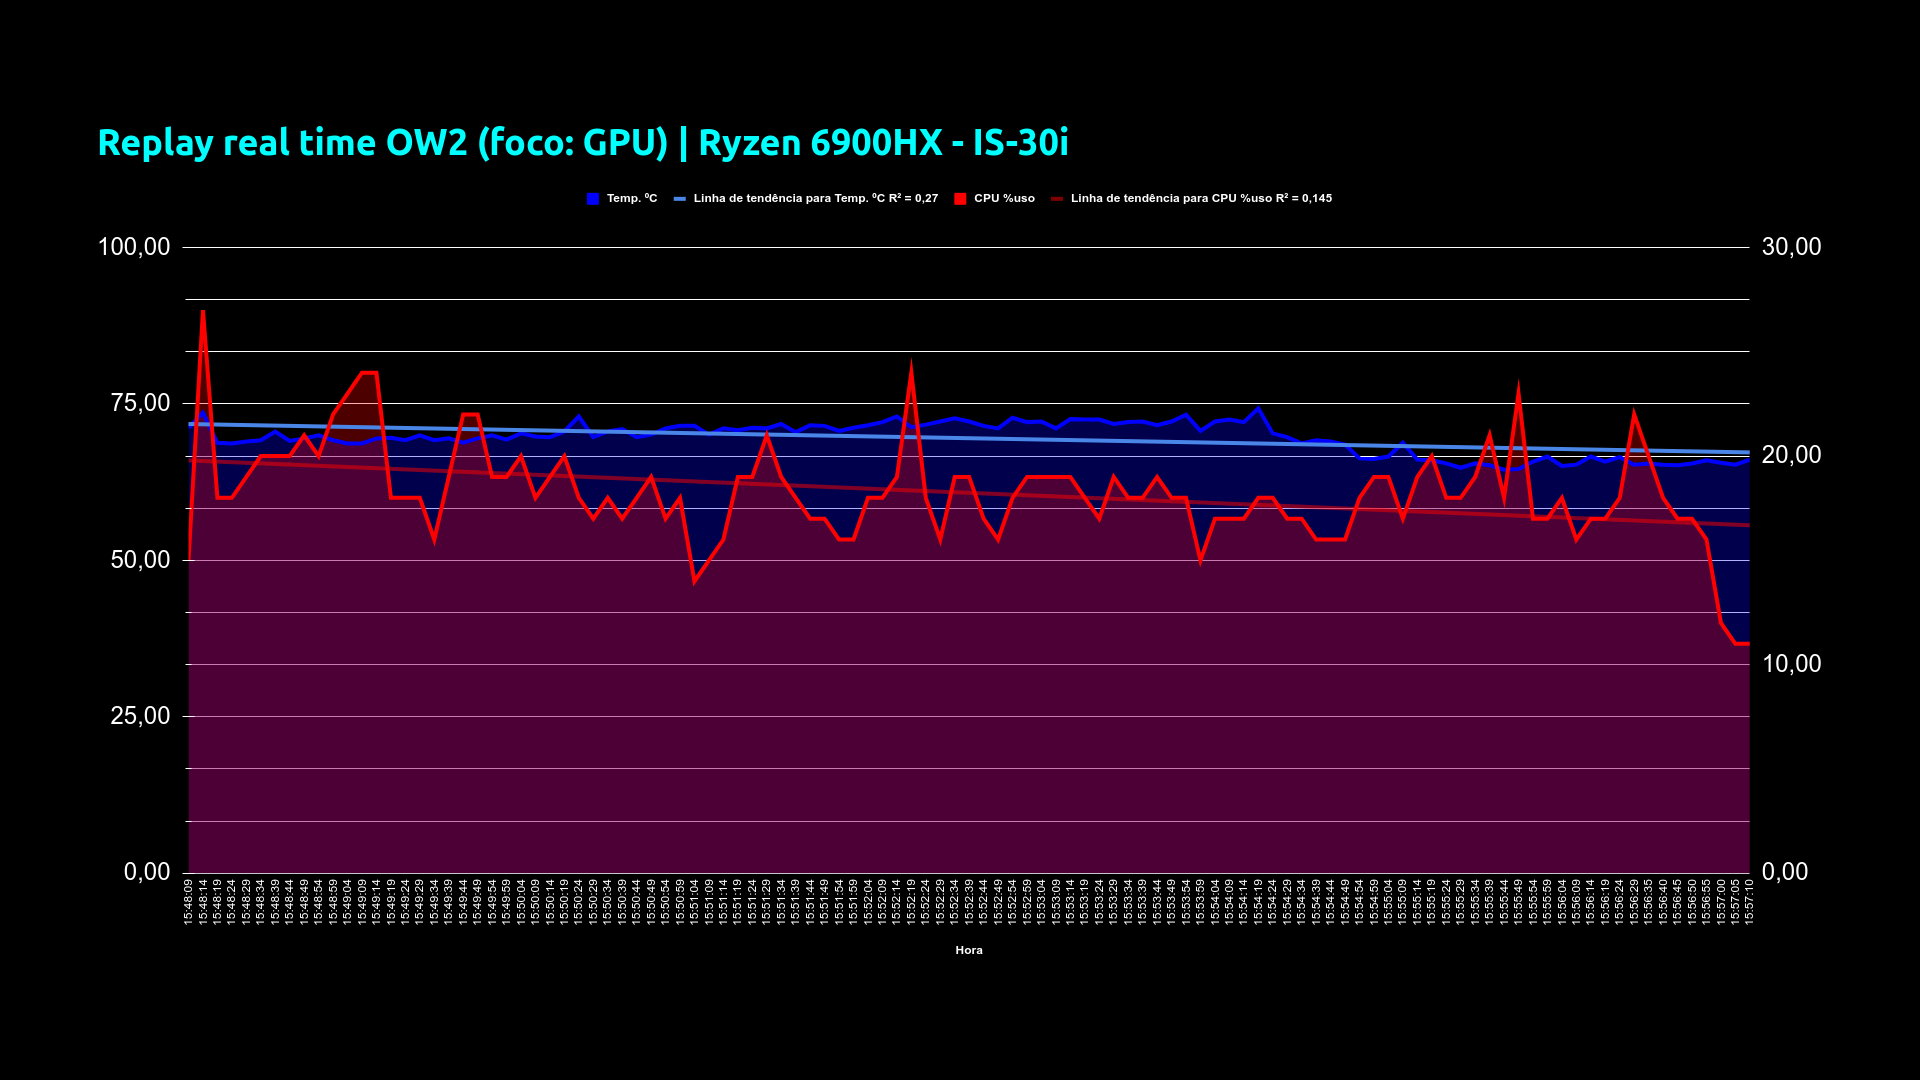
Agora pra gente pegar aqui outro uso da GPU utilizando o Overwatch2, um replay, é o modo replay ele repete uma mesma partida de modo idêntico, e foram tomadas as amostras de temperatura e o uso de CPU mantendo exatas configurações. Olhando aqui então na parte do CPU o que que a gente tem, o uso na casa, aqui ó, média aqui mais ou menos de uns 15 por cento. Nós vamos ver isso melhor agora e a temperatura aqui a gente já vê ela não tava batendo no máximo, estava mantendo a temperatura aí um pouco acima do 75 graus vamos dizer aqui né, um pouco acima do 75. Quando a gente foi para o cooler novo o is30, nós já vemos aqui uma queda global na massa de temperatura. Uma queda global e nós vemos aqui a parte do processamento de CPU um pouco mais elevado. É aquilo que eu tava falando da mudança comportamental mesmo com o sistema mais arrefecido a CPU consegue subir mais a utilização dela.
Foram consideradas o total de 109 amostras para os dois testes. Aqui o intervalo de 109
amostras onde a temperatura média era de 78 graus com cooler padrão e caiu para 69 graus, mais ou menos, com cooler novo que deu uma variação aí de 9.26 graus na média de uso da CPU. A gente já viu é de 16 saindo para os 18, ou seja, teve um incremento aí de 2%.
E a temperatura ambiente mais uma vez não foi exatamente igual. Um pouquinho mais
fresco, mas muito pouco. Nesse dia que foi medida aqui com o IS-30 né 0.45 grau célsio que entra ainda dentro da margem de erro perfeitamente, não invalida, o tanto que ele conseguiu de abaixar a média da temperatura.
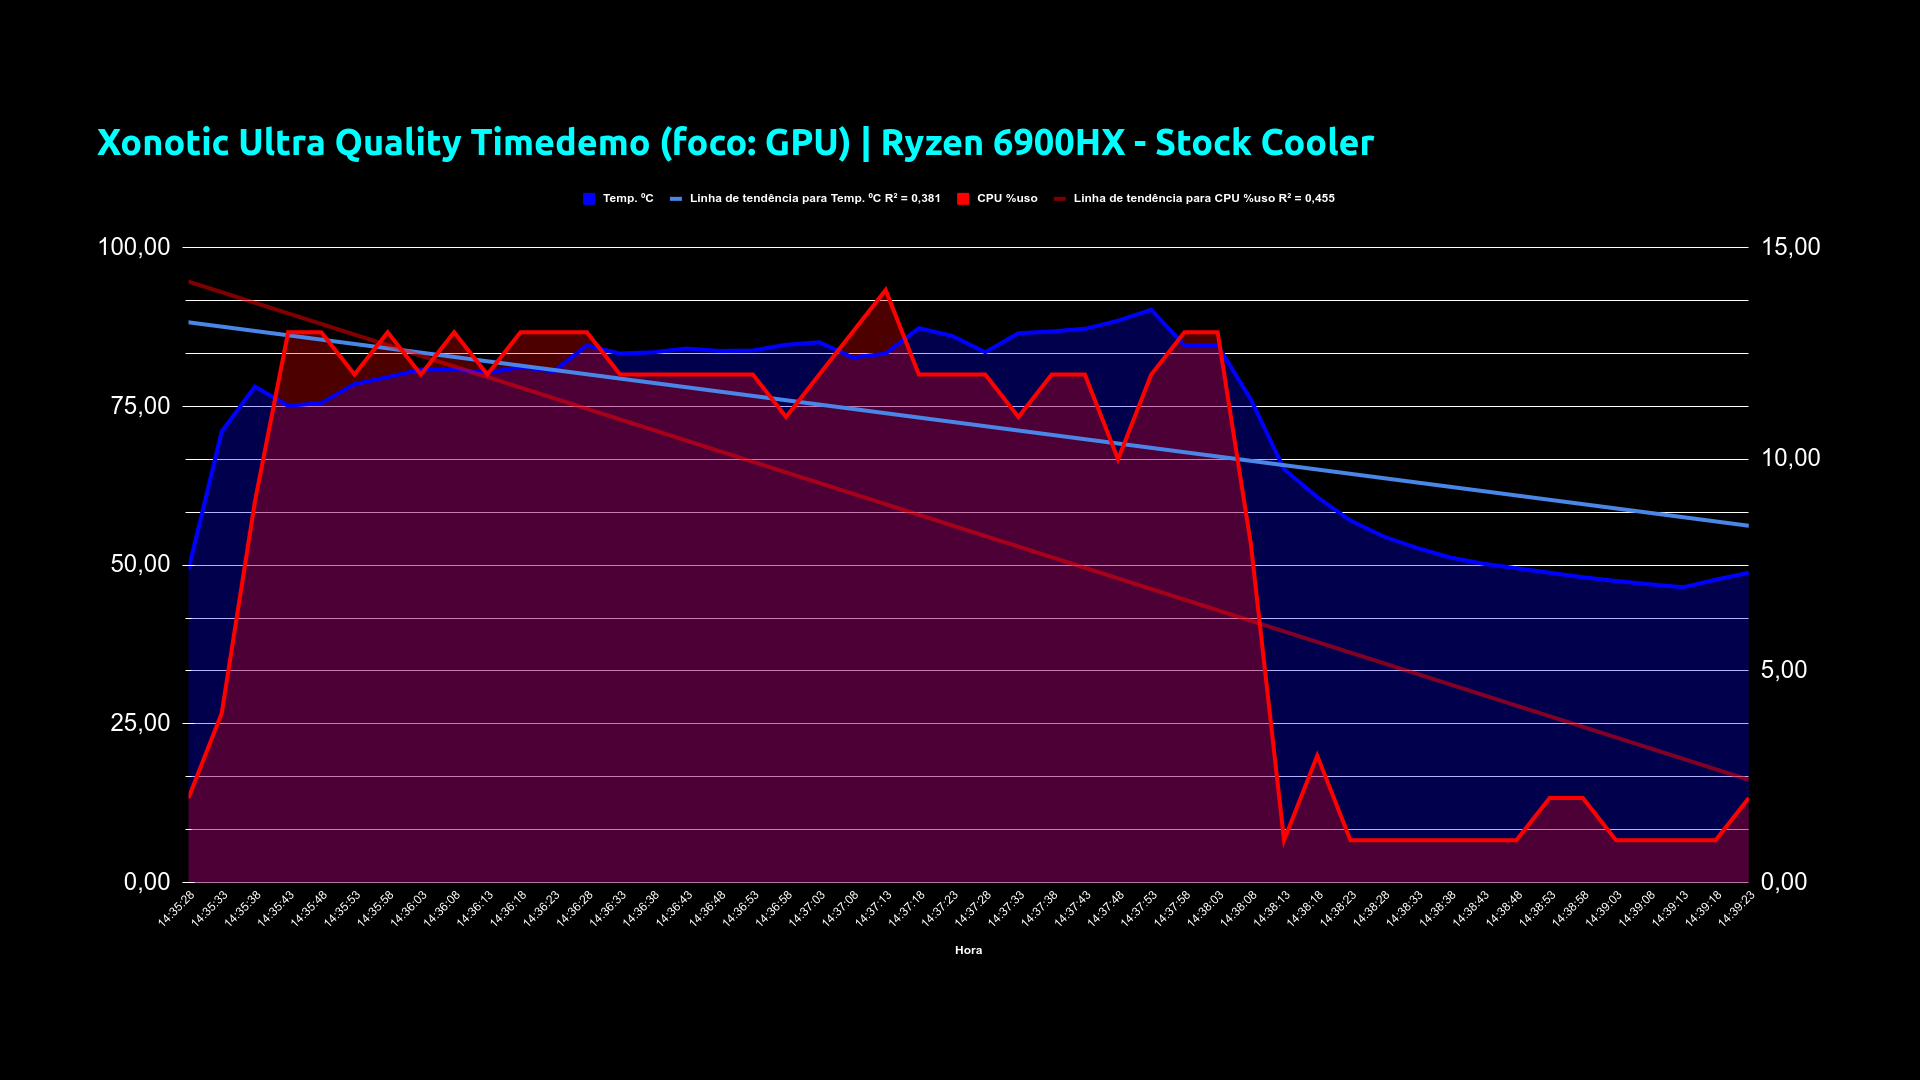
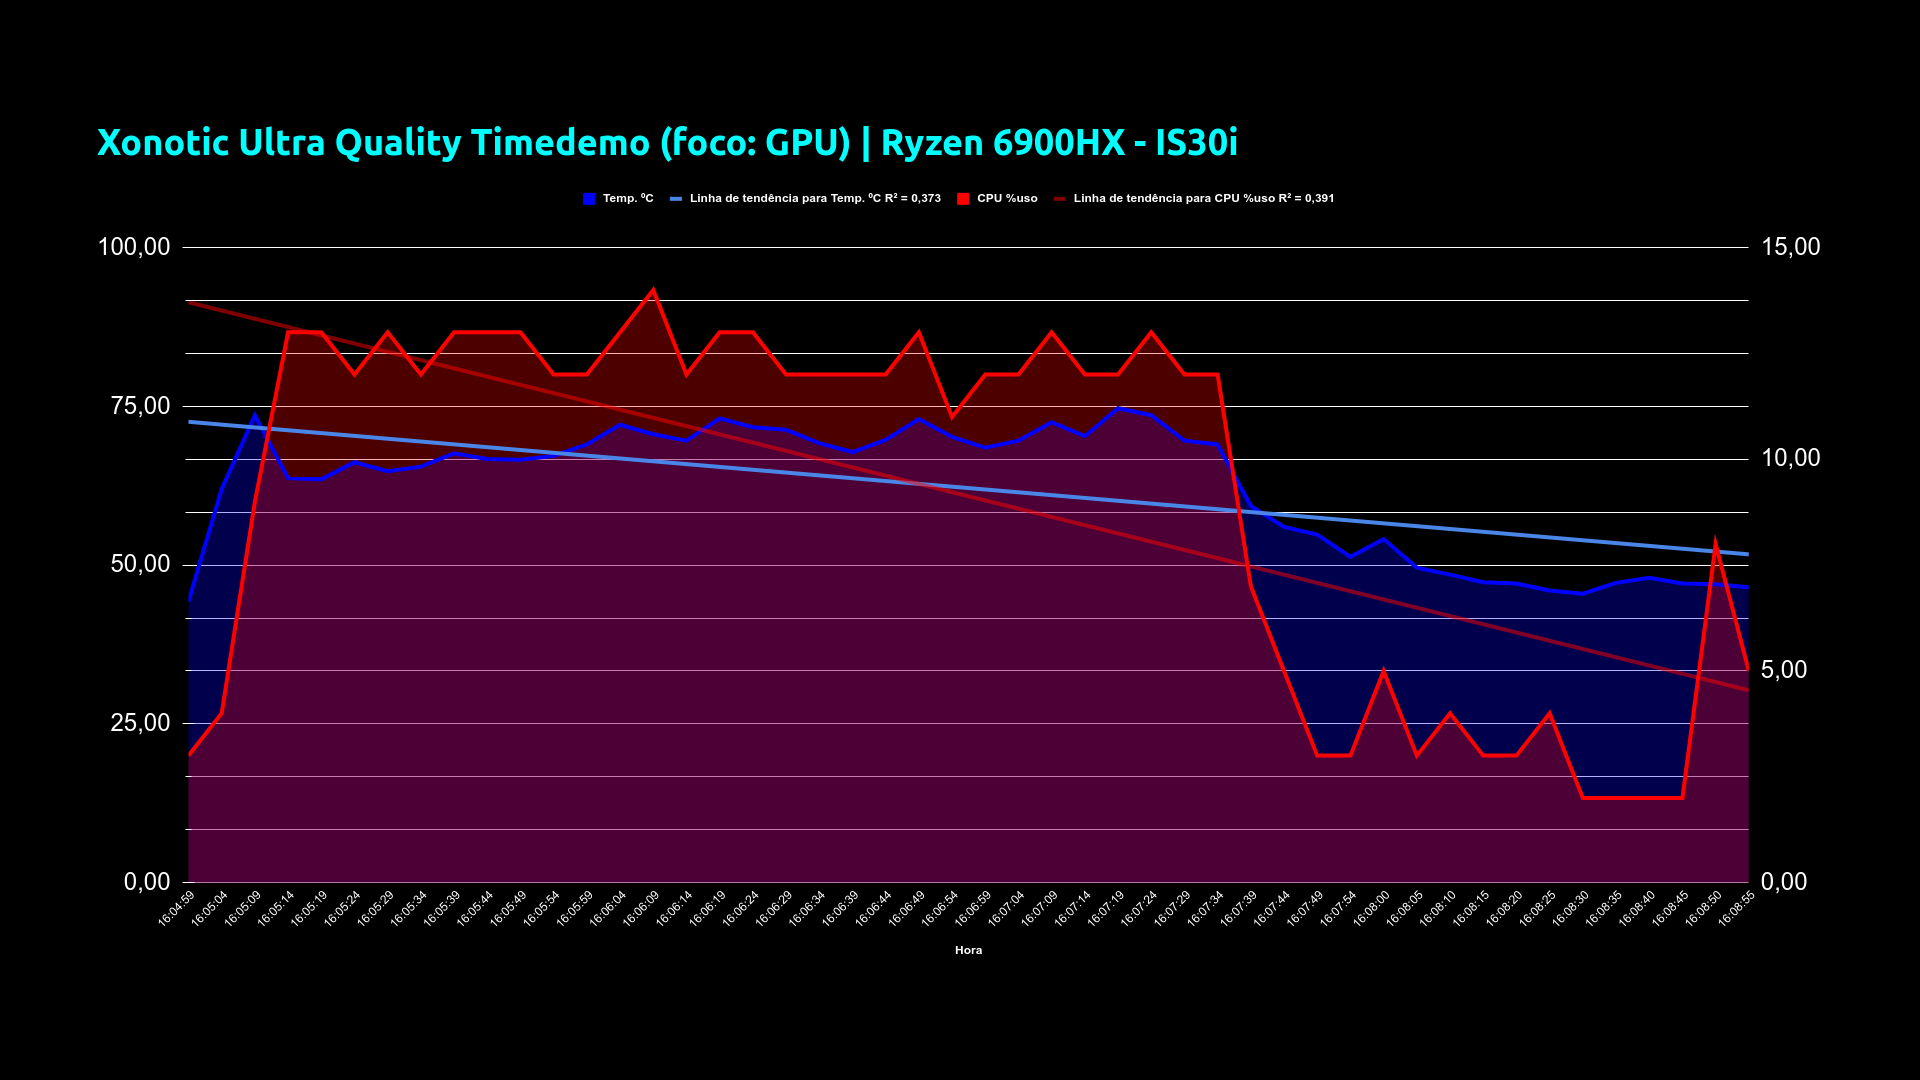
Seguindo agora para mais um teste baseado em GPU nós temos o Xonotic utilizando uma Gameplay. Aqui, o timedemo, na verdade e em 1080 né, com a ultra qualidade, tudo no máximo do máximo em termos de gráfico do jogo, tá? Então nesse timedemo ele repete a mesma partida e sem nenhuma alteração, é a mesma quantidade de frames renderizados.
E aí foram anotadas também as tomadas de amostras de temperatura e uso, de temperatura e uso da CPU.
Focando aqui no gráfico, vamos acompanhando aqui: Nesse, nós temos aqui, saindo de uma situação mais tranquila apesar de que o jogo já estava rodando. Nós temos aí uma rápida subida da CPU aqui na hora que o timedemo inicia e temos a temperatura que também sobe e não chega a bater nem explorar o limite do TJ Max. Mas a gente tem uma
temperatura aqui bem elevada, né, e depois quando acaba o timedemo ele desce pra normalidade e fica ali baixo dentro do jogo com processamento bem menor. Quando a gente muda aqui, utilizando aí a mesma quantidade de amostras, o intervalo de amostra né a gente já consegue ver aqui mais uma vez uma redução na média da temperatura e o uso similar de CPU. Lembrando que, na síntese, o que que a gente tem aqui né.
Foram considerado 48 amostras nos dois testes.
A média de temperatura que saiu do cooler padrão, saiu da média 72 para 62, tivemos a queda aí de 10º em média.
O uso de CPU nós tivemos uma pequena elevação, mas considera assim um empate técnico. Mas é sempre importante ver isso daí que ela tem uma leve tendência a ficar melhor, ou seja, aumentando performance, rendimento.
A temperatura local nesse momento nesse dia em que estava sendo feita a medida com o cooler novo, tava 1.40 grau célsio mais fresco. Ainda não invalida em nada. E sim, reduz aqui um pouquinho do valor, mas não invalida. E aí, o quê que a gente observa aqui sobre a estatística apresentada pelo próprio jogo lá no timedemo:
Nós saímos no FPS mínimo de 79 para 78, houve uma pequena queda de performance vamos dizer assim.
Aqui, porém, ele compensou e elevou na média. Houve uma média maior de frames por segundo. E atingiu o FPS máximo em um score maior também. Perfeito!
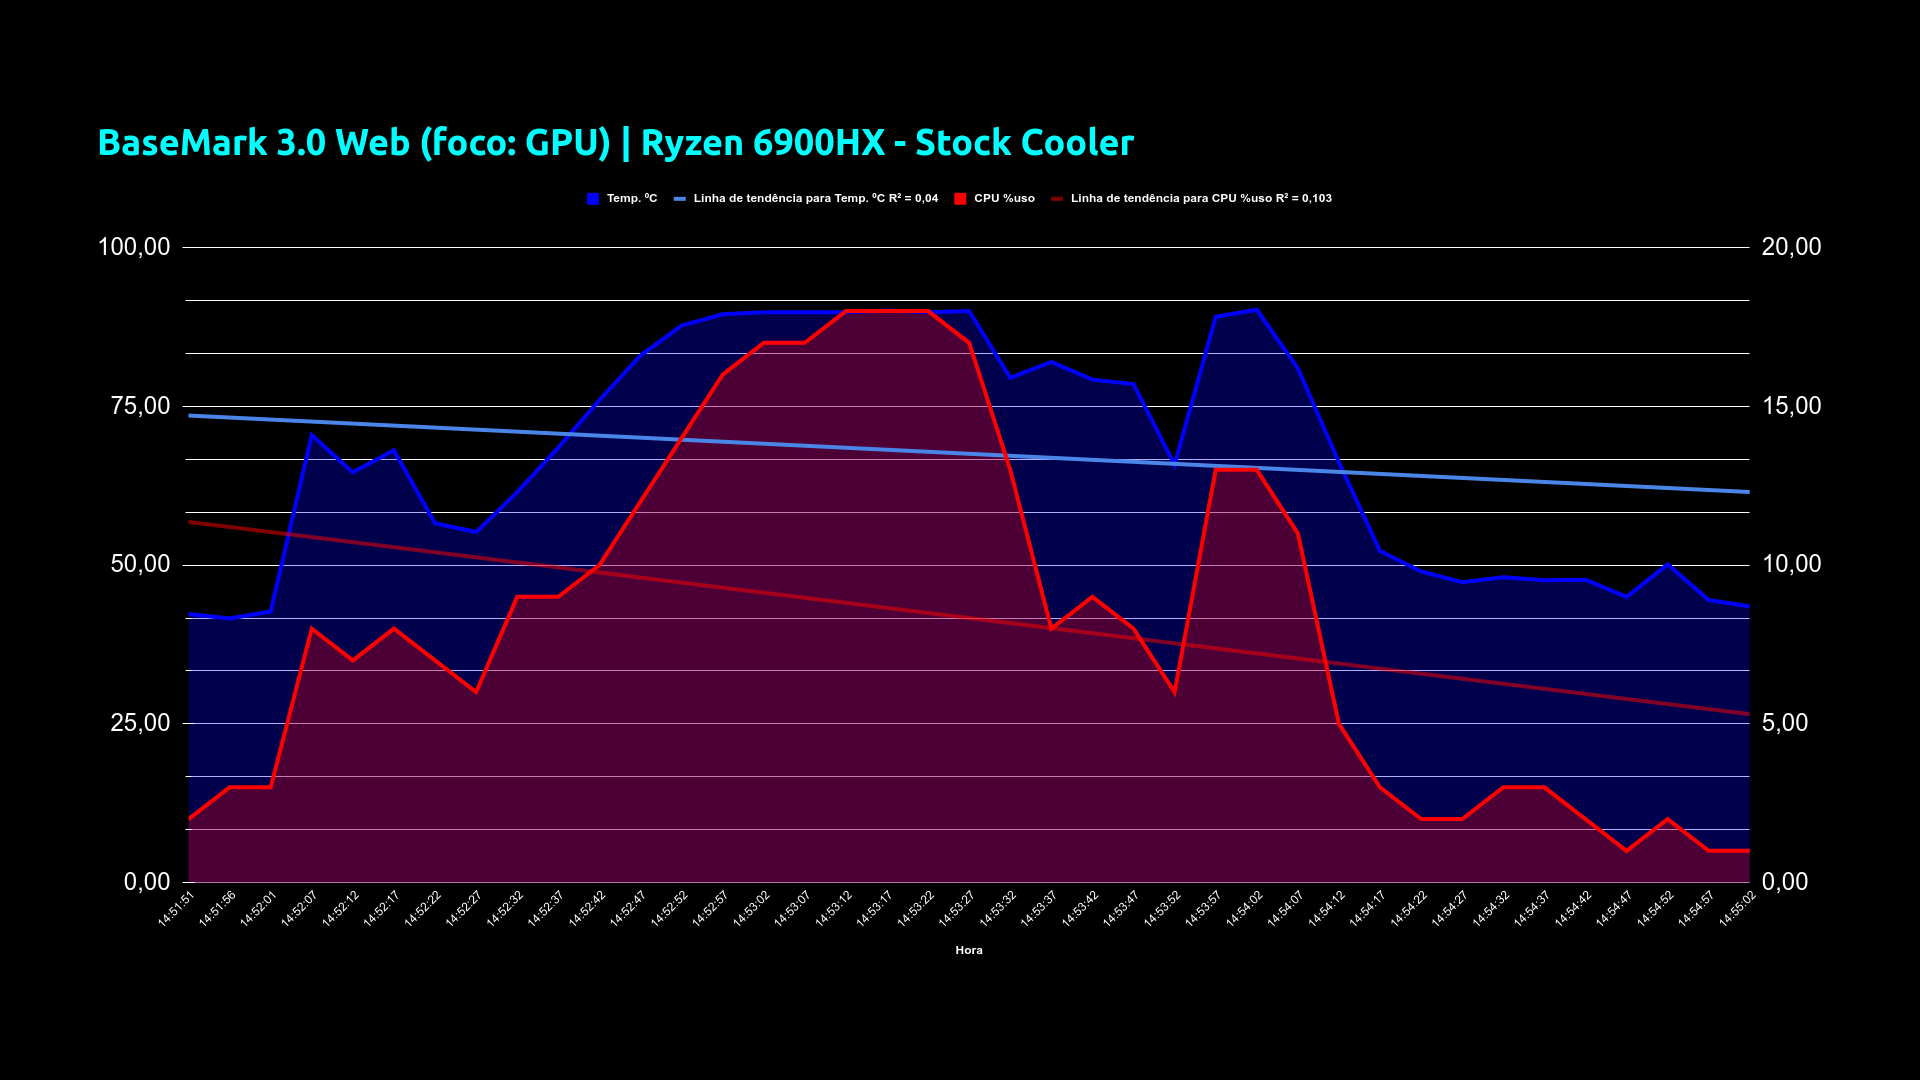
O outro teste aqui é o Basemark 3.0. Ele simula vários workflows de requisitos visual ou gráficos explorando a diversidade de tecnologias como JavaScript webgl CSS e document Open Object Model.
Verificando aqui o gráfico inicialmente com o cooler padrão, o cooler que vem no mini PC, o Morefine M600, tá, nós vemos aqui que a temperatura em azul, ela subindo conforme o processo vai pesando lá em em tela visualmente. E a gente vê também de forma um comportamento bem similar à questão da CPU também. Subindo bem próximo graficamente no teste quando sobe, ali a gente vê aqui que em alguns momentos ele quase bate a temperatura máxima utilizando o cooler padrão. E a carga de processamento que apesar dele tá subindo vendo aqui, não se enganem, ok?
Nós temos escalas diferentes: para temperatura enquanto que ela mede de 0 a 100 graus, com limite de 90 no TJ Max, o processador aqui ó ele parece que tá muito alto mas ele tá numa escala bem menor. Você vê que ele não tá atingindo nem 20%, ou seja, porque o foco aqui é o teste de GPU, perfeito!
Como que fica na hora que a gente trocou? É, nós vimos aí alterações né, onde a gente conseguiu. Vamos voltar e ver de novo? Ó, o quê que a gente vê aqui ó?
Há uma redução né, na temperatura em algumas regiões aqui e há uma certa, é,
vamos dizer assim, não tão é sobe e desce, mas subida com uma descida mais linear, mais constante no uso da CPU e também bem num patamar aqui e onde as mínimas são mais elevadas como a gente pode conferir isso daqui ó matematicamente nas estatísticas, né.
39 amostras consideradas para ambos os testes.
A temperatura média que é de 67 caiu para 63, ou seja, uma redução aí de 4.
O uso médio da CPU ele saiu de 8,33 subiu para 8,9, ou seja, é aquilo que eu falei na parte inferior ele deu uma ligeira corrigida uma ligeira subida ali, mas vamos dizer que foi empate técnico, tá.
E a temperatura local ambiente, é, também nesse dia da medida aqui com o IS-30, ele estava num dia um pouquinho mais fresco -1,30 graus em relação ao outro dia. Mesmo assim, ainda aqui pela diferença não invalida, certo?
E nós tivemos aqui na pontuação uma melhora. Saímos de 1290 para pouco mais de 1333, elevando aí 3,22 por cento a mais. Mais uma vez, configurando basicamente uma baixa de temperatura em média e uma alta de performance em média.
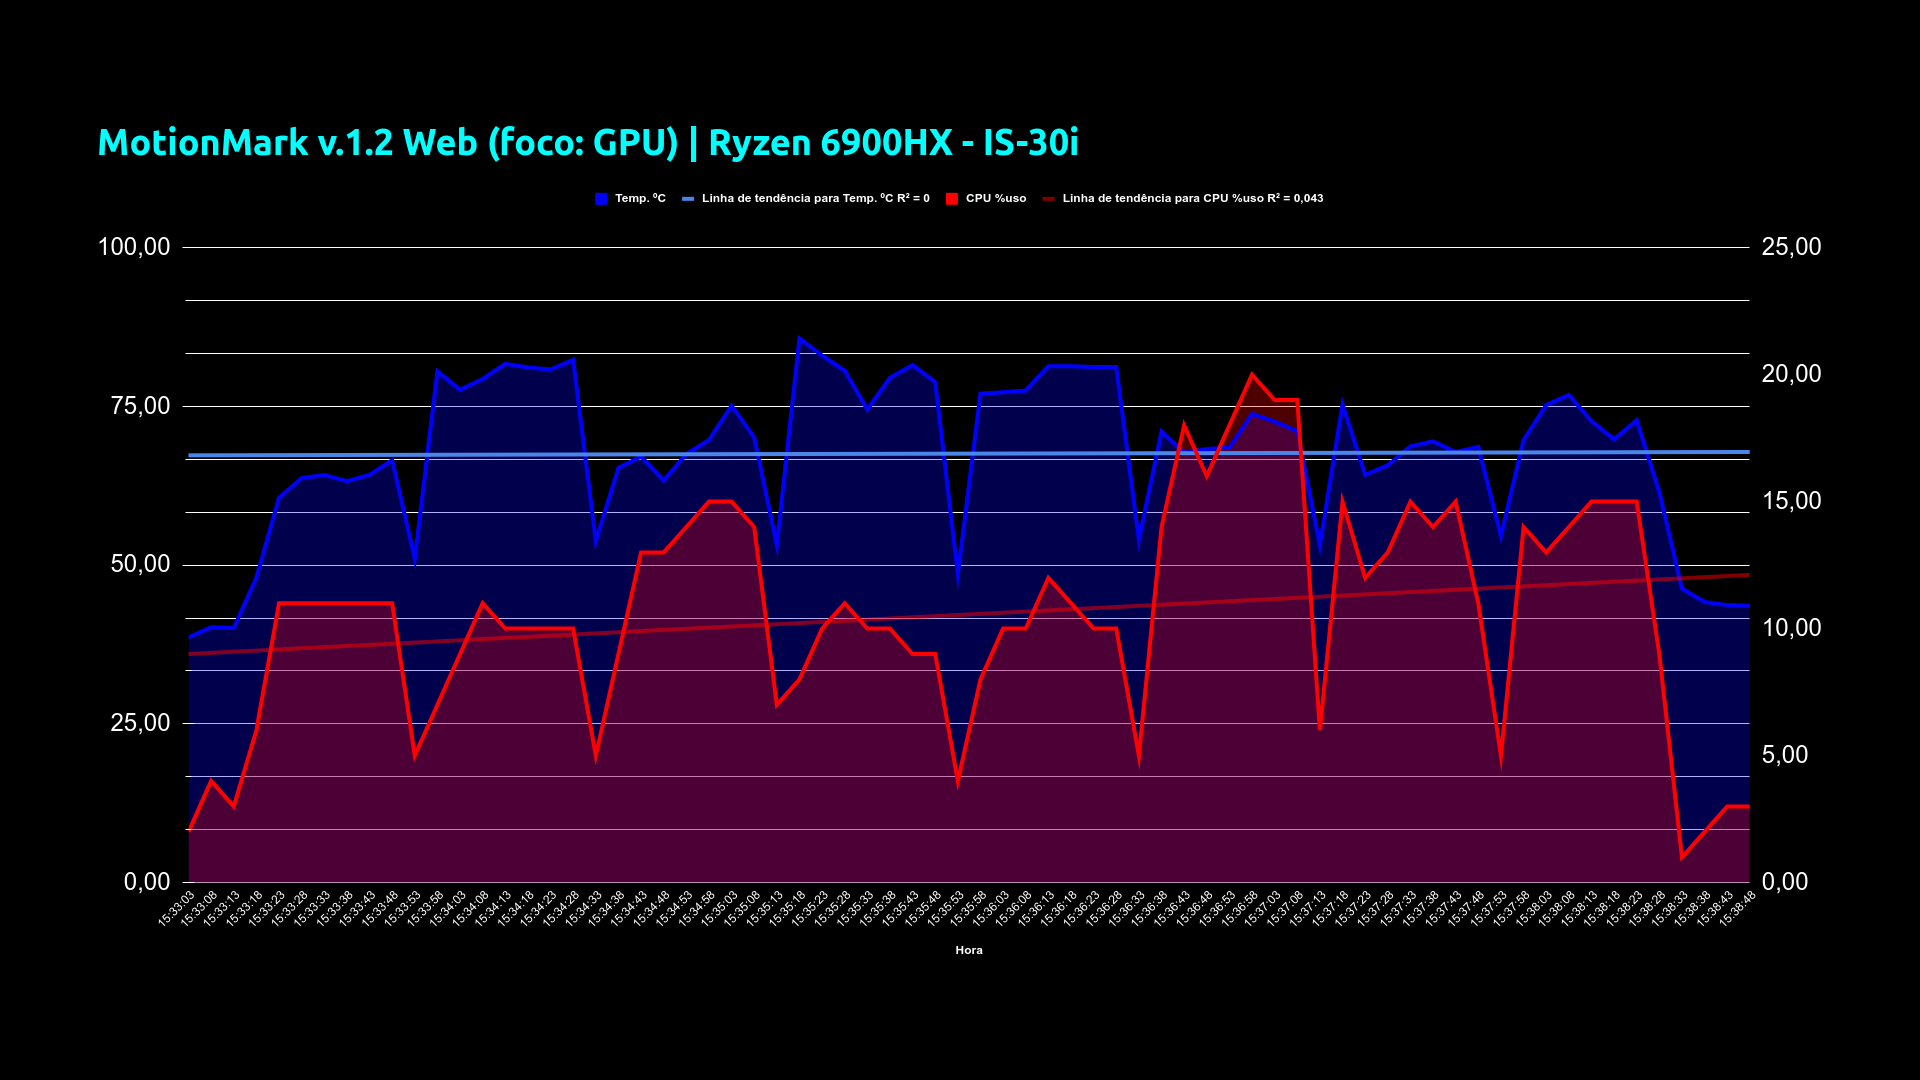
Um outro aqui é o MotionMark que é uma suíte de teste de gráficos que eu também já trouxe aqui em vídeos passados. O MotionMark visa medir a capacidade de animar cenas complexas numa expectativa de taxa de quadros usando o navegador e os seus recursos online. Foco na GPU.
No primeiro gráfico que é o gráfico do Stock cooler, que é cooler padrão, nós temos aqui em azul a temperatura e em vermelho a CPU. Note que a temperatura ela não chega extrapolar ou ficar batendo no na linha dos 90 no TJ Max, ela dá uma subida, chega quase bater lá e desce e fica ali corrigindo. E a CPU, com uso bem baixo, aqui se a gente for olhar nós temos aqui limite dela batendo nos 20 e 20 e pouco acima. Certo, vamos ver a mudança para quando a gente muda aqui o gráfico.
Nós tivemos aqui uma redução média, foi visivelmente e deu pra gente ver uma redução média na temperatura, ok. E tivemos aqui quase o mesmo desenho do percentual de uso de CPU. Vamos matematicamente tirar as dúvidas.
Nós tivemos aí 70 com 70 amostras consideradas no intervalo.
Nós tivemos uma temperatura média saindo de 75 e pouco para para 67 tendo aí uma redução global de 7.61 ao longo desse período em média, ok?
E o uso de CPU médio a gente teve aquele ligeiro ligeiro aumento quase que é empate técnico vamos dizer assim.
A temperatura local nesse dia ainda era ainda de um dia mais fresco. Não tem como alterar o tempo né? rs. É mais fresco -1,40 graus, mesmo assim ainda não invalida e fica dentro de uma margem de erro.
Aí, e a pontuação mais uma vez, apesar de pouco, mas tivemos uma melhoria de 1,94 da pontuação aqui no MotionMark.
E aí? Valeu a pena? Olha eu vou mostrar para vocês agora detalhes valiosos sobre a troca.
Primeira coisa que vamos falar aqui é sobre o investimento.
Pelo site oficial ID-Cooling, apesar de ter listado lojas e distribuidores por regiões, inclusive tem o Brasil, nem todos os lugares estão habilitados. O mais interessante aqui em termos de entrega Global evidentemente é entre o Aliexpress e a Amazon.
Eu coloquei aqui como referência a loja oficial no AliExpress deles e o modelo IS-30i está $45 mais $26 de frete, isso levando aí para ter referência do preço do dólar no site em 5/10 de 2023. Porém, eu mesmo comprei em outro, inclusive tem o link para quem quiser comprar na CloudFan Store, o mesmo modelo só que pagando $22,64 e o frete grátis. Beleza então! Foi nessa loja que eu comprei e é o mesmo produto.
O tempo de instalação eu calculo aí por volta de 2 horas devido a alguns imprevistos. Evidentemente não é algo que eu trabalho e faço todo dia, então quem tá aí no dia dia trabalhando nessa parte mais técnica vai ter uma habilidade uma destreza muito maior para
para fazer isso. Ainda mais agora vendo esse vídeo e tendo aqui o aviso sobre esses imprevistos.
Beleza beleza pessoal! Agora, nem tudo são flores! Deixa eu contar algumas dificuldades durante o processo que é valioso vocês saberem.
Logo que instalei o dissipador e cooler verifiquei uma distância livre ou falta de apoio adequado para a parte posterior de fixação do dissipador. Um espaçador de controle. O problema é que isso não veio no kit e na verdade nem acredito que venha pois é algo que deve variar de fabricante e esse ajuste fino caberá ou à montadora ou ao usuário. E só depois de chegar nesse ponto que recordei que um inscrito do canal tinha falado sobre isso. Então, depois de tentar algumas gambiarras eu olhei o conjunto original e vi que tinha os anéis espaçadores e resolvi removê-los e enxertar no novo conjunto. Tudo beleza se não fosse o problema que o original só tem 3 pontos para apoio e faltou 1!!! Daí tive que improvisar e usei um pé de silicone com altura quase igual, mas milimetricamente diferente. Evidente que no aperto final chegou o contato do dissipador sobre o die da APU. Mas ficou a dúvida se a instalação ficou 100% eficiente a dúvida de que se com os espaçadores certos e uma instalação sem dificuldades o resultado pode ser ligeiramente melhor, pouca coisa, mas pode porque no meio dessa dessa lambança, vamos dizer assim, acaba que a passa térmica sai do lugar, porque ele encosta desencosta. Ou seja, Eu acredito que tem como ele ficar ligeiramente melhor!
E o barulho? Como que fica a sensação do antes versus depois com o novo cooler?
Utilizando aí um decibelímetro, eu fiz a captação do som antes de ligar o cooler novo e depois de ligar ele. E no momento em que ele estava também sendo 100% utilizado em termos de potência eu estava usando bastante. Ai, fiz o teste do Cinebench de novo só para ele jogar o processador lá para o máximo e portanto ele utilizar na curva de velocidade o 100% pra gente verificar o barulho.
Aqui vocês vão ver escutar logo logo. A captação foi feita pelo celular, mas só para ter uma referência. O mais importante mesmo a ver aqui é o número para dar referência se tá mais ou menos perto do que é a especificação técnica dele em termos de ruído ou não.
Como a gente pode ver aí 23 dBA é um barulho bem tranquilo e considerando que ele tá totalmente aberto e a medição foi feita a distância de quatro dedos entre o cooler em relação ao decibelímetro.
Chegando mais próximo evidentemente que deve chegar na margem superior que tem pela especificação técnica que fala que ele pode chegar até uns 35 dbA.
Então é isso! Ahh e em relação ao cooler original o IS-30 é muito mais silencioso, muito mais!
Pessoal, fazendo um apanhado geral, os testes validam utilizações mais extremas do que na utilização no cotidiano, Ou seja, a performance dia a dia pode ser ainda melhor dado que os picos de processos terão mais facilidade de elevar a velocidade do processador de repouso para o turbo ou boost máximo. Isso ocorrendo em maior quantidade de vezes, sem limitações constantes, aliado a uma média de temperatura global menor que anteriormente, reduzirá o efeito de desgaste, e assim, aumentando a longevidade do equipamento. Contudo ainda tendo a certeza de que no uso extremo está mais protegido.
Outro aspecto bem legal verificado foi que em caso de jogos, onde o uso de GPU é mais intenso a CPU normalmente trabalha mais aliviada e porque toda a APU está mais arrefecida isso acaba permitindo que inclusive a própria CPU consiga subir mais a performance auxiliando ainda mais a GPU.
Por fim, no âmbito geral, numa perspectiva de longevidade, pode-se dizer que vale o investimento para estabilidade do equipamento, durabilidade e potencialização de performance.
Com isso pessoal, vou encerrando aqui, e por trazer esse conteúdo valioso peço a vocês que deixem o LIKE, se inscrevam e principalmente DIVULGUE e participem nos comentários! Sua contribuição é essencial para o avanço do canal e para que eu traga novos vídeos!
Então eu vou indo nessa e falouuuuuuu!
// ENGLISH SUBTITLE TRANSCRIPT
Hey, what’s up?
Guys, the cooling system in machines that suffer from the Joule effect is a fundamental part of consistent performance. The equipment’s performance is linked to how much it can use its theoretical maximum capacity without losing out to the heat that damages everything!
With this in mind, I decided to go ahead with replacing the ventilation system of my mini pc, the Morefine M600, which I have made several important videos for those who have a similar machine or even for decision-makers who want to buy a mini desktop with an explicit reference of use.
Without further ado, I’m going to give you a behind-the-scenes look at the exchange that I tried to perform in a laboratory setting, using statistical inference, as well as explaining data modeling to understand the results. And I confess that it was a very laborious process, but quite satisfactory in delivering reliable data for your decision making.
Now! You know what’s much, much easier? Your LIKE! Smash your finger on the Like, it’s easy and satisfying for all of us! Also, subscribe to the channel and activate the bell to receive ALL notifications. I’m counting on you, really!
Ahhh, I need to highlight and thank the subscribers here on the channel who told me about this cooler possibility and that was the kick-start for me to look for more information and bring it directly to all of you. Thank you so much for your contributions! You guys are awesome!
Following the boat, the steps for changing the heatsink-cooler assembly were:
. Creating the action plan;
. Searching for a script in which I could store the data during each test;
. Modeling the data in a visual format for Before Vs After;
. Recording each test considering two groups: CPU focus and GPU focus;
. Standardization of configurations and equipment in order to introduce less variation, reducing the margin of error.
Want more details? Check out the blog after the video! Link in the description
Great! Now that we’ve seen the cooler we’ve chosen, let’s get to the analysis.
Important about Before Vs. After
. BIOS settings = identical;
. Cooler speed curve profile = identical;
. Operating system = identical;
. Apps, versions and settings = identical;
. Recording and measuring equipment = identical;
. VARIABLE = HEATSINK AND COOLER
Let’s go to the tests! Let’s go. Did it work out well?
From script to Data-Vis
Look, it was executed via CLI during the test, a data sample was collected every 5 seconds, then this file was output to the csv type where it was imported and processing was carried out in a spreadsheet program, right, spreadsheet processing was done Then, the data was processed and the visualization graphs were then generated.
An important warning about the synthesis of results:
Number of samples corresponds to the amount of data collected in a unit of time seeking data symmetry.
The average temperature in degrees Celsius of the CPU as well as the usage in percentage on average of the CPU is considered in the pre-test, during and post-test until it almost reaches a rest
Degrees Celsius The local ambient temperature in degrees was monitored using a simple digital thermometer. The value considered as reference was the one at which it remained the longest throughout the test.
And the score is the explicit and specific criterion for each of the tests.
First test, the Silver Bench is a 100% CPU test using only JavaScript and which, through a light mapping rendering engine, verifies the ability to perform the test in time.
Looking at the rendering graph here, we have here at first the plot of the Stock cooler, that is, the original standard cooler. What do we already notice here? Let’s take a look here, in relation to the temperature here in yellow, we see that it soon rises and it becomes practically linear, reaching 90º, which is limited by the BIOS in the TJ Max, it stays at 90º. At the same time, CPU usage is also well above, practically at 100%.
And then when we did the test with the new cooler, we already noticed that although it basically maintained 100% of the process, right there with the processor, the temperature already had a very good drop. She left the limit in her 90s and has already taken a breather. And we even see that he finished the test slightly before the other.
Let’s see this here, in summary:
You see, we collected the samples and considered the region of 54 samples in each of the tests to be the same and we saw that there was a drop in the average CPU temperature. We went from a level of 82 or so to a level of 70, that is, we effectively had a reduction of 12 degrees in the average temperature. As for the average percentage of CPU usage, we saw here that there was also a drop from the 80s to the 76s, a reduction in the percentage level of CPU usage of four percentage points here.
And we see the following, that on day one, the test was carried out with a standard cooler at local temperature, room temperature measured by the thermometer, which you can see in that summary video which is super accelerated, it was at 28.70 degrees Celsius and on the day another one that was measured with the new cooler, the is30, was already hotter. It was a warmer day with 29.20 degrees Celsius at that time, that is, half a degree higher. Although this actually didn’t have much of an impact, despite a margin of error, of course, he still managed to do a good job.
Here the new cooler reduces the average CPU temperature and interestingly we also see here that the score has increased. As it was shown to us in the graph, we saw that in addition to lowering the average temperature, it managed to achieve an increase of 4.56 percent in performance with better performance! Pretty cool huh!
Let’s continue here. Let’s go to the next test.
Now we go to CPU Expert. It is a test focused on CPU power, it simulates several calculations and raises the level, at the same time as the thread load increases, generating hash, which are increasingly larger mathematical algorithms.
Taking the reference graph here with the standard cooler, we just see the CPU usage curve here in green growing until it reaches the limit when it has multiple threads enabled there. And we also see the CPU temperature rising more quickly and reaching the TJ Max of 90 degrees Celsius, which is the limit in the Bios protection. When we go to the new cooler, we already see the same ladder here, right, the scale of increase in CPU usage as well, and we also see the scale of increase in the average temperature of the processor. But once again it is no longer beating the TJ Max. What we see in summary here, we captured 72 samples in the two tests. We once again had a drop in the average temperature, a total of 8.51 degrees Celsius in temperature. We had basically the same percentage of CPU usage. Remember here that, this average, despite it reaching 100%, right, the average, it considers the moment almost resting for total processing and resting again. That’s why the average is lower than the maximum it reaches. Perfect! What about the ambient temperature? We had a little higher temperature, that is, the second test with a new cooler, the is30, was carried out with a little more temperature, that is, it still managed to do excellent cooling of the system. And the score, we went from 153 to 151 or so, increasing it by 1.22 percent. We continue to gain performance.
Following the test, this is the Cine Bench R23. I’ve already brought it here in other videos, including the mini PC. It is software that aims to test extreme CPU usage using both one core and multiple cores. In this case, it was only the multiple cores that I used, okay? Through advanced mathematical calculations that will render a three-dimensional model transforming into a realistic photograph.
In the graph here, as we can already check this from here, we have the temperature in yellow, right. Taking the consideration of the samples already rising and quickly it hits the TJ Max and it stays practically the entire time of the rendering there stuck at 90 degrees Celsius and the CPU hitting it at the top and giving those sudden drops that they represent, because exactly how It’s hitting the limit and it tries to go up by giving Boost beyond the 100% CPU it has. The Boost, right, and then it goes up and back, right, it cools down, it goes up and then goes down again and it stays in this oscillation.
When we go for the new cooler, what happens is the CPU process is exactly the same. It goes to maximum CPU, there are times when it drops and rises to maximum again, but the temperature we can already see here that it has already cooled down, it has already dropped compared to the previous one. Let’s see that number!
Look, number of samples 132. Samples in both tests.
We saw that the average temperature dropped from 88 degrees to 76 or so, that is, it dropped 12.39 degrees Celsius in the average temperature. Whereas the average CPU percentage, considering margin of error and everything, it almost stayed the same, but still it’s a slight, a slight increase of 4.11 percent on average.
Okay, the ambient temperature here once again, right, the day was warming up faster so in the second test with the new cooler it was already a little warmer, 0.55 degrees Celsius more, right, which gives a certain disadvantage, but still So we see that he managed to achieve a great reduction in the average temperature and the score improved, right?
He managed to go from 12,580 to 13,155, that is, he increased by 4.37 percent.
Now moving on to rendering the video using kdenlive, which is the video editing software that I use, basically all the videos here on the channel were made
exporting the same video using the Encoder profile, the h265, okay, via the CPU, it wasn’t with the help of a video card or anything, it was strictly using the CPU. A video standard at 1080p 60 frames per second. In reality, the video is footage from an OverWatch 2 Gameplay that I had recorded. So, even fine-tuning the Encoder in relation to: thread quality, parallel processing and Encoder speed. It was used equally. And what did we see here in the graph plot?
We leave a state here that is more of the beginning of processing and the load goes to maximum quickly, where we have once again here as the excessive use of the CPU it hits the TJ Max of 90º with the standard CPU, right, the standard cooler and we have an oscillation here, here coming and going.
Here in relation to the percentage of CPU usage, it is on average around 90 or 80 percent. When we change, do the same test with the is30 that we can now repair? The CPU had a very similar graph, also beating some moments. It went even further and we see here the drop in the average temperature across the entire curve of the process carried out here. Seeing this in summary, what do we have?
122 samples were collected. In reality, considering 112 samples, the collection time was longer, but here we considered 122, which is exactly the same interval. Where the average CPU temperature once again went from 88 to 75, decreasing the average by 13.31! Very good, the CPU practically unchanged, right, only increasing by 3.111, but people don’t even consider that much.
The ambient temperature at that time was correct at the time I was doing the tests, it was 29.50 at the longest period considering the longest period of the test at that same temperature. And here we can see a 3.48 percent performance gain. Remembering that rendering takes time, and the less time you spend rendering the same file means you are getting better performance, which is what happens. It renders in 488 seconds at first and then in the same video it renders in 471! Show!
Next, we go here to GLMark 2. Using wayland, okay?
The operating system, although I haven’t mentioned it before, is independent here because everything was kept the same, but I was using Ubuntu LTS 22.04 here.
Then GLMark2, a test that aims to measure the potential of the graphics set with the CPU using real-time 3D visual rendering technologies, using the opengl api.
Seeing the graph plotting here, there is already a change in behavior because the first tests were focused on those benchmarks that use the CPU excessively. In this one they are focused on those that use the GPU excessively. However, like this Ryzen mini-pc, it uses an APU. What is this? It’s a processor that comes together, you know, it works with both the CPU and the GPU there in one socket. So you have this APU, so one thing ends up having a direct impact on the other, both in processing in a certain way and in the general distribution temperature. Then we start to see how cool it is… Using the standard cooler, what we have here is the temperature almost beating the TJ Max, but it’s quite high at all times during the GL Mark 2, isn’t it? That the CPU usage, as we can even see in the trend line here, is lower, we are using the CPU in the average range of 15%, let’s say, right?
So let’s see how the curve went. Look how cool! What we saw here now when we switched to the IS-30, we practically maintained CPU percentage usage but we had a significant drop in the temperature of the APU as a whole, which is really cool seeing this now in the synthesis.
There were 74 samples evaluated in the two where we had the average temperature of the CPU, and when it is the CPU here, in reality, as I said, it is the APU, right, and it encompasses both things a little. But going from a scenario of 82 to 69, that is, a drop of 13 points in temperature, right?
Within the percentage of average CPU usage we will start to see an interesting factor here that, as the system is cooled, look, we will start to see the CPU rising even with the drop in temperature, but here there is still something negligible. say so, but she’s already changing her trend, right?
The ambient temperature, although on that second day it was 0.20 degrees Celsius lower, right. Let’s say that this is within the margin of error, it doesn’t interfere with anything, it’s as if it were here instead of 13.28 it was here 12.50 or 13 degrees, right?
Well, and the score, we observe once again that it practically maintained stability, right? But with slight growth.
Now for us to look at another use of the GPU using Overwatch2, a replay, it is the replay mode, it repeats the same match in an identical way, and temperature samples and CPU usage were taken while maintaining exact settings. Looking here at the CPU side of what we have, the usage in the house, here, the average here is around 15 percent. We’re going to look at this better now and the temperature here we can already see was not reaching the maximum, it was maintaining the temperature a little above 75 degrees, let’s say here, right, a little above 75. When we went to the cooler new is30, we already see here a global drop in temperature mass. A global drop and we see here the CPU processing part is a little higher. That’s what I was talking about, the behavioral change, even with the system cooler, the CPU’s usage can increase more.
A total of 109 samples were considered for the two tests. Here the range of 109
samples where the average temperature was 78 degrees with the standard cooler and dropped to 69 degrees, more or less, with the new cooler which gave a variation of 9.26 degrees in the average CPU usage. We’ve already seen it from 16 to 18, that is, there was an increase of 2%.
And the ambient temperature was once again not exactly the same. A little bit more
fresh, but very little. On that day that it was measured here with the IS-30, it was 0.45 degrees Celsius, which is still within the margin of error perfectly, it does not invalidate the amount he managed to lower the average temperature.
Now moving on to another GPU-based test, we have Xonotic using a Gameplay. Here, the timedemo, actually in 1080, right, with ultra quality, everything at maximum maximum in terms of game graphics, okay? So in this timedemo it repeats the same game and without any changes, it’s the same number of frames rendered.
And then the temperature and usage samples taken, temperature and CPU usage were also noted.
Focusing here on the graph, let’s follow it here: In this one, we have it here, coming out of a calmer situation despite the game already running. We have a rapid rise in the CPU here at the time the timedemo starts and we have the temperature that also rises and does not reach or explore the TJ Max limit. But we have a
The temperature here is very high, right, and then when the time demo ends it drops to normal and stays low within the game with much less processing. When we change here, using the same number of samples, the sample interval, we can see here once again a reduction in the average temperature and similar CPU usage. Remembering that, in summary, what we have here, right?
48 samples were considered in the two tests.
The average temperature that came from the standard cooler went from an average of 72 to 62, we had a drop of 10º on average.
We had a small increase in CPU usage, but this is considered a technical draw. But it is always important to see that it has a slight tendency to get better, that is, increasing performance and income.
The local temperature at that time on that day when the measurement was being taken with the new cooler, was 1.40 degrees Celsius cooler. It still doesn’t invalidate anything. And yes, it reduces the value a little here, but it does not invalidate it. So, what do we observe here about the statistics presented by the game itself in the timedemo:
We went from a minimum FPS of 79 to 78, there was a small drop in performance, let’s put it that way.
Here, however, he compensated and raised the average. There was a higher average number of frames per second. And it reached the maximum FPS at a higher score too. Perfect!
The other test here is Basemark 3.0. It simulates various visual or graphical requirements workflows by exploiting the diversity of technologies such as JavaScript webgl CSS and document Open Object Model.
Checking the graph here initially with the standard cooler, the cooler that comes with the mini PC, the Morefine M600, okay, we see here that the temperature in blue, rising as the process weighs on the screen visually. And we also see behavior very similar to the CPU issue as well. Going up very close graphically in the test when it goes up, we see here that at times it almost reaches the maximum temperature using the standard cooler. And the processing load, despite it, is rising, as you can see here, make no mistake, ok?
We have different scales: for temperature, while it measures from 0 to 100 degrees, with a limit of 90 on the TJ Max, the processor here looks like it is very high but it is on a much smaller scale. You see that it is not even reaching 20%, that is, because the focus here is the GPU test, perfect!
What does it look like when we change? Yes, we saw changes there, right, where we got it. Shall we go back and see it again? Oh, what do we see here?
There is a reduction, you know, in the temperature in some regions here and there is a certain, yes,
Let’s put it this way, it’s not so much an up and down, but an up and down with a more linear descent, more constant in CPU usage and also at a level here where the minimums are higher as we can check this from here mathematically in the statistics, huh.
39 samples considered for both tests.
The average temperature of 67 dropped to 63, that is, a reduction of 4.
The average CPU usage went from 8.33 to 8.9, in other words, that’s what I said at the bottom, there was a slight correction, a slight increase there, but let’s say it was a technical draw, okay.
And the local ambient temperature, yes, also on that day of the measurement here with the IS-30, it was a little cooler -1.30 degrees compared to the other day. Even so, the difference still doesn’t invalidate it, right?
And we saw an improvement here in the score. We went from 1290 to just over 1333, increasing 3.22 percent more. Once again, basically configuring a low temperature on average and a high performance on average.
Another one here is MotionMark, which is a graphics test suite that I have also brought here in past videos. MotionMark aims to measure the ability to animate complex scenes at a frame rate expectation using the browser and its online resources. Focus on the GPU.
In the first graph, which is the Stock cooler graph, which is a standard cooler, we have the temperature here in blue and the CPU in red. Note that the temperature does not go beyond the limits or reach the 90s at TJ Max, it rises, almost reaches there and drops and stays there correcting. And the CPU, with very low usage, here if we look we have its limit here reaching the 20s and 20s and a little above. Okay, let’s see the change when we change the graph here.
We had an average reduction here, it was visible and we could see an average reduction in temperature, ok. And here we had almost the same drawing of the CPU usage percentage. Let’s mathematically resolve the doubts.
We had 70 with 70 samples considered in the range.
We had an average temperature going from 75 or so to 67, resulting in an overall reduction of 7.61 over this period on average, ok?
And we had that slight increase in average CPU usage, which is almost a technical draw, let’s put it that way.
The local temperature that day was still one day cooler. There’s no way to change the time, right? LOL. It’s cooler -1.40 degrees, but it still doesn’t invalidate and remains within a margin of error.
There, and the score once again, although little, we had an improvement of 1.94 in the score here at MotionMark.
And there? Worth it? Look, I’m going to show you valuable details about the exchange now.
The first thing we’re going to talk about here is investment.
On the official ID-Cooling website, despite having listed stores and distributors by region, including Brazil, not all places are enabled. The most interesting thing here in terms of Global delivery is obviously between Aliexpress and Amazon.
I put their official store on AliExpress here as a reference and the IS-30i model is $45 plus $26 shipping, which means there is a reference for the dollar price on the website on 5/10, 2023. However, I bought it myself from another , there is even a link for those who want to buy from the CloudFan Store, the same model but paying $22.64 and free shipping. Beauty then! It was in this store that I bought it and it is the same product.
I estimate the installation time to be around 2 hours due to some unforeseen circumstances. Obviously it’s not something that I work on and do every day, so whoever is there every day working on this more technical part will have a much greater ability and dexterity to
to do this. Even more so now watching this video and having warning about these unforeseen events.
Beauty beauty guys! Now, not everything is rosy! Let me tell you about some difficulties during the process that are valuable for you to know.
As soon as I installed the heatsink and cooler I noticed a free distance or lack of adequate support for the rear mounting part of the heatsink. A control spacer. The problem is that this didn’t come in the kit and in fact I don’t believe it will as it is something that may vary from manufacturer to manufacturer and this fine adjustment will be up to either the manufacturer or the user. And only after reaching that point did I remember that a subscriber to the channel had talked about this. So, after trying some workarounds, I looked at the original set and saw that it had spacer rings and decided to remove them and graft them onto the new set. Everything would be great if it weren’t for the problem that the original only has 3 points for support and 1 was missing!!! So I had to improvise and used a silicone foot with almost the same height, but millimetrically different. It is evident that in the final tightening the heatsink came into contact with the APU die. But there was a doubt as to whether the installation was 100% efficient, the doubt that if with the right spacers and a hassle-free installation the result could be slightly better, not much, but it could be because in the middle of this mess, let’s put it that way, it ends up that the thermal iron moves out of place, because it leans away. In other words, I believe it can get slightly better!
And the noise? How does the before versus after feel with the new cooler?
Using a decibel meter, I captured the sound before turning on the new cooler and after turning it on. And at the moment when it was also being used 100% in terms of power, I was using it a lot. Then, I did the Cinebench test again just so it could push the processor to its maximum and therefore it would use 100% in the speed curve so we could check the noise.
Here you will hear it soon. The capture was done on a cell phone, but just to have a reference. The most important thing to see here is the number to give reference to whether it is more or less close to its technical specification in terms of noise or not.
As we can see, 23 dBA is a very quiet noise and considering that it is completely open and the measurement was made at a distance of four fingers between the cooler in relation to the decibel meter.
Getting closer, obviously, it must reach the upper margin, which the technical specification states that it can reach up to 35 dbA.
Then that’s it! Ahh and compared to the original cooler, the IS-30 is much quieter, much more!
Guys, taking a general overview, the tests validate more extreme uses than in everyday use. In other words, day-to-day performance can be even better given that process peaks will have an easier time increasing the speed of the processor from rest to the maximum turbo or boost. This occurring more often, without constant limitations, combined with a lower global average temperature than previously, will reduce the wear effect, and thus increase the longevity of the equipment. However, I am still sure that in extreme use you are better protected.
Another very cool aspect observed was that in the case of games, where the use of the GPU is more intense, the CPU usually works more relaxed and because the entire APU is cooler this ends up allowing even the CPU itself to increase its performance, helping even more. the GPU.
Finally, in general, from a longevity perspective, it can be said that it is worth the investment for equipment stability, durability and performance enhancement.
With that guys, I’m ending here, and for bringing this valuable content I ask you to LIKE, subscribe and above all SHARE and participate in the comments! Your contribution is essential for the advancement of the channel and for me to bring new videos!
So I’m going to go for it and see yaaaa!
Imagens dos Gráficos // Charts Images



Links Importantes
Site dos fabricantes
Script que coleta a temperatura e uso da CPU
. Utilizando o explorador de arquivos da sua distro, localize o arquivo criado e clicando com o botão direito marque para que o aquivo seja executável;
Antes de executar o script, tenha certeza de que ele (arquivo) esteja em um pasta que você tenha permissão de escrita. Assim que ele iniciar a execução vai gerar um novo arquivo no mesmo diretório a qual vai “printar” em formato texto com extensão CSV os dados coletados em intervalo de 5s.
Manuseie e personalize o script conforme sua necessidade.
#!/bin/bash
# by Paul Colby (http://colby.id.au), no rights reserved 😉
# Temperature inputs.
TEMP_INPUT=$(echo /sys/class/hwmon/hwmon2/temp1_input)PREV_TOTAL=0
PREV_IDLE=0while true; do
# Get the total CPU statistics, discarding the ‘cpu ‘ prefix.
CPU=(`sed -n ‘s/^cpu\s//p’ /proc/stat`)
IDLE=${CPU[3]} # Just the idle CPU time.# Calculate the total CPU time.
TOTAL=0
for VALUE in “${CPU[@]}”; do
let “TOTAL=$TOTAL+$VALUE”
done# Calculate the CPU usage since we last checked.
let “DIFF_IDLE=$IDLE-$PREV_IDLE”
let “DIFF_TOTAL=$TOTAL-$PREV_TOTAL”
let “DIFF_USAGE=(1000*($DIFF_TOTAL-$DIFF_IDLE)/$DIFF_TOTAL+5)/10”# Calculate highest CPU Temperature.
HIGH_TEMP=$(echo “scale=1; $(sort -r $TEMP_INPUT | head -n1) / 1000” | bc)# Redirect CPU temperature and % of CPU usage to file.
echo “$(date ‘+%H:%M:%S’);${HIGH_TEMP};${DIFF_USAGE}” >> Ryzen6900_k10TempTctl.csv# Remember the total and idle CPU times for the next check.
PREV_TOTAL=”$TOTAL”
PREV_IDLE=”$IDLE”# Wait before checking again.
sleep 5
done
#id-cooling #minipc #morefine #aarproducoes
~Thumbnail criada utilizando Krita Software~
📎 https://krita.org/en/
~Vídeo editado e renderizado utilizando KdenLive~
📎 https://kdenlive.org/
EU APOIO SOFTWARES OPEN SOURCE!
Inovação aberta e produtividade
✅ ©Copyright 2023
✅ Proibida reprodução integral ou de partes deste material sem autorização prévia!
✅ Vídeo produzido com 💟 para aarProTech™.
✅ aarProTech™ é uma marca da família AAR Produções®.
✅ Todos os direitos reservados à AAR Produções®
Aviso: todas as marcas e direitos autorais são de seus respectivos proprietários legais e são aqui mencionadas apenas para efeito de propósitos informativos.
Linux® é uma marca registrada de Linus Torvalds nos Estados Unidos e em outros países. Para saber mais sobre a marca registrada Linux®, visite o link abaixo:
https://www.linuxmark.org/
Linux®
Curta e compartilhe! Sou um entusiasta e sigo compartilhando algumas informações úteis buscando levar oportunidade a outros que apreciam soluções tecnológicas e dicas essenciais para aumentar a sensação de melhoria em qualidade de vida.


